10 housing markets where buyers have the most power—and 10 where they have the least
10 housing markets where buyers have the most power—and 10 where they have the least
To identify which markets might offer buyers the most luck right now, ResiClub analyzed sale-to-list ratios.
Want more housing market stories from Lance Lambert’s ResiClub in your inbox? Subscribe to the ResiClub newsletter.
The U.S. housing market is now passing through the seasonally soft window of the year. This period outside of the spring season is usually when regional markets experiencing home price corrections will see the most price give-up.
To identify which metro-area markets might offer buyers the most luck or power right now, ResiClub analyzed the June 2024 sale-to-list ratio calculated by Zillow and released late last month.
A sale-to-list ratio above 1.0 means the typical home in that metro sold for more than the list price, while a ratio below 1.0 means the typical home sold for less than the list price.
Among the 250 largest metro-area housing markets, these 10 had the highest sale-to-list ratio:
- Rochester, New York —> 1.19
- Buffalo —> 1.08
- San Jose —> 1.07
- Syracuse, New York —> 1.06
- Hartford, Connecticut —> 1.06
- Trenton, New Jersey —> 1.05
- San Francisco —> 1.05
- Bridgeport, Connecticut —> 1.04
- Manchester, New Hampshire —> 1.04
- Madison, Wisconsin —> 1.04
Among the 250 largest metro-area housing markets, these 10 had the lowest sale-to-list ratio:
- Naples, Florida —> 0.95
- Cape Coral, Florida —> 0.95
- Punta Gorda, Florida —> 0.95
- Panama City, Florida —> 0.95
- Macon, Georgia —> 0.96
- North Port, Florida —> 0.96
- Jackson, Tennessee —> 0.96
- Bowling Green, Kentucky —> 0.96
- Miami —> 0.96
- Port St. Lucie, Florida —> 0.96
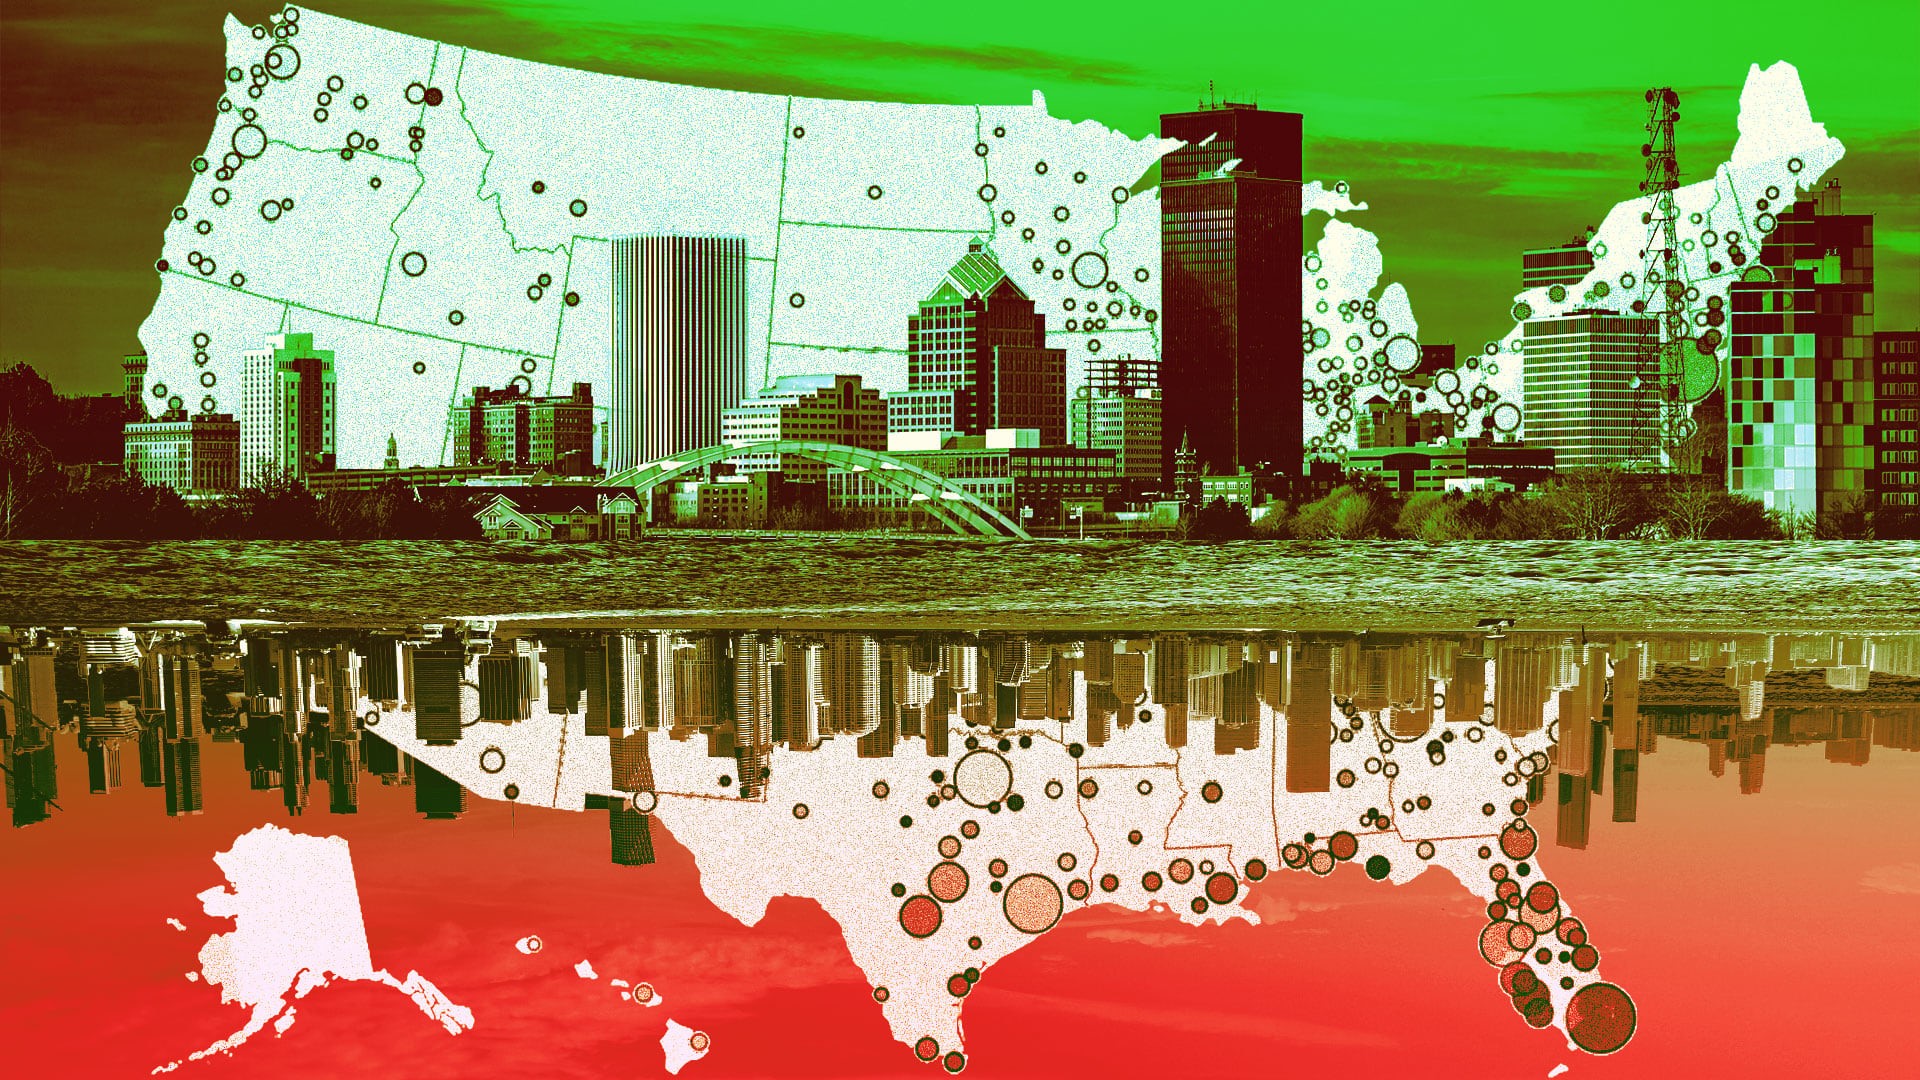
So in other words, in Buffalo, the typical home is selling for 8% above its list price on average, while in Naples, Florida, the typical home is selling for 5% below its list price.
As ResiClub has well documented, many housing markets in the Northeast, the Midwest, the Bay Area, and Southern California have been stronger and tighter this year, while many areas in the Sun Belt, particularly resale markets around the Gulf, have been softer and weaker.
Unlike many Sun Belt housing markets, many Northeast and Midwest markets have lower levels of homebuilding. As new supply becomes available in Southwest and Southeast markets—and builders use affordability adjustments like buydowns to move it—an additional cooling effect is created in the resale market. The Northeast and Midwest don’t have that same level of new supply, so resale and existing homes are pretty much the only game in town.
Another factor driving the bifurcation is that some pockets of the Sun Belt and Mountain West experienced even greater home price growth during the Pandemic Housing Boom, which stretched fundamentals too far beyond local incomes. Once pandemic-fueled migration slowed, and rates spiked, it became an issue in places like Austin and Naples.
ABOUT THE AUTHOR
Fast Company
(4)


