2017 Halloween Celebration & Spending Statistics [Infographic]
— October 31, 2017
![2017 Halloween Celebration and Spending Statistics [Infographic] | DeviceDaily.com 2017 Halloween Celebration and Spending Statistics [Infographic] | DeviceDaily.com](https://www.devicedaily.com/wp-content/uploads/2017/11/2017-Halloween-Celebration-Spending-Statistics-Infographic.png)
QuinceMedia / Pixabay
The National Retail Federation has been conducting an annual Halloween survey since 2003. The last time we reported on it was in 2015 with our Halloween Fun Facts blog.
Each year they project how Americans will celebrate this Spooktacular holiday, the third most popular holiday in the country.
Spending for Halloween in 2017 is projected to reach a record high of $ 9.1 billion, this is up from $ 8.4 billion in 2016 and $ 6.9 billion in 2015.
Per the NRF:
“Total planned spending is estimated to reach $ 9.1 billion…Costumes will make up the largest share of spending, coming in at roughly $ 3.4 billion. Men ($ 96) plan to spend nearly $ 20 more, on average, than women ($ 77).”
Here are a few more interesting highlights from their 2017 survey.
Halloween Activities
- 7 in 10 people plan to celebrate Halloween in 2017.
- 70% will hand out candy.
- 49% will decorate their homes.
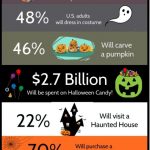
- 48% will dress up in a costume.
- 46% will carve a pumpkin.
- 30% will go trick-or-treating.
- 22% will visit a haunted house.
Halloween Spending
- $ 86.13 is the average each household will spend on Halloween.
- Total projected Halloween spending is $ 9.1 billion.
- $ 2.4 billion will be spent on costumes.
- $ 2.7 billion will be spent on candy
- 7 billion will be spent on decorations.
Halloween Inspiration
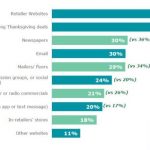
- 35% will conduct an online search for Halloween ideas.
- 30% will go to a retail store to find Halloween possibilities.
- 20% will consult with friends or family.
- 18% will search Facebook for ideas.
- 17% will use Pinterest for inspiration.
Halloween Shopping
- 20% will begin shopping for Halloween in September.
- 43% will begin shopping in the first 2 weeks of October.
- 20% will shop the final 2 weeks of October.
- 95% will purchase candy.
- 72% will purchase decorations.
- 69% will purchase costumes.
- 47% will get their candy/décor/costumes at a discount store.
- 34% will get their candy/décor/costumes at a Halloween store.
- 22% will get their candy/décor/costumes online.
Top 3 Adult Costumes
- Witch
- Batman Character (Batman, Catwoman, etc.)
- Animal (Cat, Dog, etc.)
Top 3 Kids Costumes
- Action/Superhero
- Batman Character/Princess
- Animal
Top 3 Pet Costumes
- Pumpkin
- Hot Dog
- Dog/Lion/Pirate
![2017 Halloween Celebration and Spending Statistics [Infographic] | DeviceDaily.com 2017 Halloween Celebration and Spending Statistics [Infographic] | DeviceDaily.com](https://www.devicedaily.com/wp-content/uploads/2017/11/2017-Halloween-Celebration-Spending-Statistics-Infographic.jpg)
Digital & Social Articles on Business 2 Community
(56)


