3 charts that explain the U.S.’s new records in renewable energy generation
This piece originally appeared on Inside Climate News. It is republished with permission. Sign up for their newsletter here.
To make a swift transition to a cleaner grid, the United States needs to set records for renewable electricity generation pretty much every single quarter. So far in 2022, the numbers are encouraging.
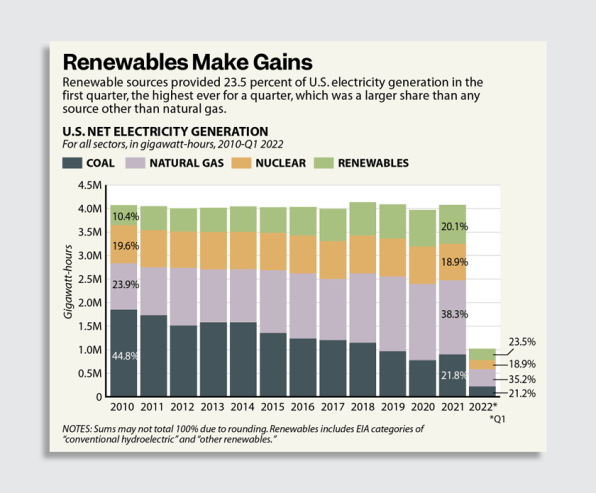
From January to March, renewable energy power plants generated 242,956 gigawatt hours (GWh), which was 23.5% of U.S. electricity generation; both records—an increase from 19.5% in the first quarter of 2021, and 20.8% in the full year. The growth was thanks in part to more than 80 new wind and solar plants that went online during the quarter. The figures are from the Energy Information Administration.
But before you celebrate, it’s important to note that reaching new highs is expected in our rapidly changing energy economy. The thing to pay attention to is the size of the gains, says Michelle Solomon, a policy analyst for the think tank Energy Innovation. “What we really need to do is accelerate the deployment of renewables over time,” she says.
I spoke with Solomon and her colleague, Dan Esposito, a senior policy analyst, about the latest numbers.
Esposito says the growth in wind and solar came in spite of various challenges faced by developers, including shortages of some parts and long waits to get approval to connect to the grid. The share of renewables almost definitely would have been larger without those obstacles. “It’s been a very challenging environment over the last year or two for development, in general,” he says.

[Image: Paul Horn/courtesy Inside Climate News]
As renewables gained ground, coal lost a little. Coal was at 21.2% for the quarter, down a fraction of a percentage point, both from the same quarter last year and the prior year.
Natural gas remains the country’s leading fuel for power plants, with gas-fired plants producing 35.2% of U.S. electricity generation in the first quarter. This was a slight increase from 34.7% in the first quarter of last year, and a decrease from 38.3% in all of 2021.
Natural gas prices have spiked this year, but that hasn’t yet translated into a substantial decrease in the use of gas to produce electricity.
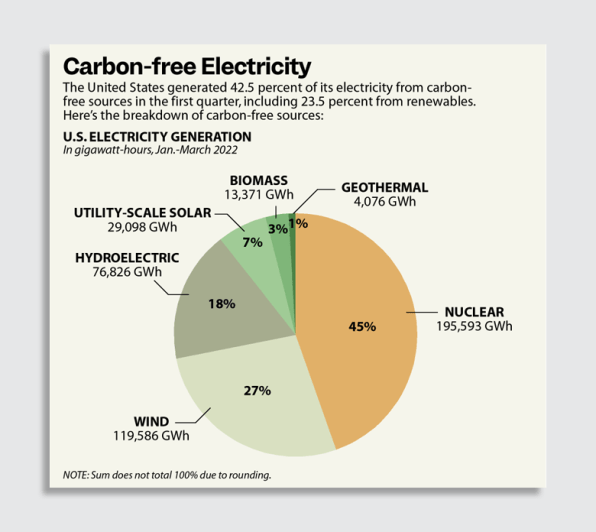
I was expecting to see a decrease in hydropower, considering the many reports of declining water levels at major hydroelectric plants. But hydropower was up, with 7.4% of the U.S. total for the quarter compared to 7% in the first quarter of last year and 6.3% in an unusually low 2021. The main reason for the increase was that the two leading states for hydropower, Washington and Oregon, reported large gains from their plants, and most other states reported at least some increase. This is one to watch as we head into a hot summer.
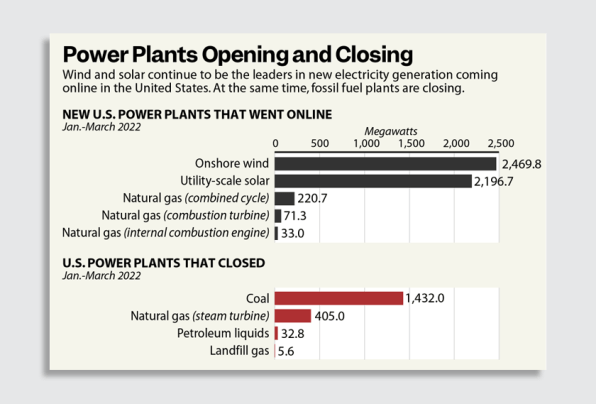
More than 120 new power plants began operating in the first quarter, most of which were wind or solar farms.
The new wind farms were on the large side, with 11 projects producing a total of 2,469.8 megawatts. Solar projects came in a wide variety of sizes, with 71 projects and a total of 2,196.7 megawatts.

[Image: Paul Horn/courtesy Inside Climate News]
Four coal-fired power plants closed during the quarter, including two big ones: Avon Lake plant near Cleveland, which went online in 1970, and had a capacity of 680 megawatts; and Cheswick Generating Station near Pittsburgh, which also went online in 1970, and had capacity of 637 megawatts.
Whenever we talk about the capacity of various types of power plants, it’s important to specify that a megawatt of a plant that can run around the clock is not the same as a megawatt of intermittent sources like wind and solar.
For example, the country’s nuclear plants run almost all the time, so a 500-megawatt plant is going to generate close to its maximum possible output of 12,000 megawatt hours (MWh) in a day (500 megawatts multiplied by 24 hours). Coal and gas plants are capable of running around the clock, but in practice they run much less, based on many factors, including the availability of lower-cost alternatives.
Solar and wind have some of the lowest operational costs, but they also generate some of the least electricity relative to capacity. A 500-megawatt wind farm generates about 4,200 MWh in a day, and a 500-megawatt solar farm generates about 3,000 MWh, based on national averages.
So it’s going to take a lot of wind and solar to replace older plants as they reach the end of their lives. Power system planners understand this, but I don’t think the public yet grasps the magnitude of construction that needs to take place. (For more detail, Energy Innovation and the University of California, Berkeley, issued a report last year that looked at scenarios for getting to 80% carbon-free electricity by 2030.)

[Image: Paul Horn/courtesy Inside Climate News]
The system also needs a mix of other resources, which could include new geothermal, nuclear, and other technologies, plus lots of energy storage to help fill in any gaps. That’s part of how to make carbon-free electricity grow at the pace required to help avoid the worst effects of climate change. And we’re getting there—if we keep accelerating.
Fast Company , Read Full Story
(26)


