by Joe Mandese@mp_joemandese, August 25, 2016

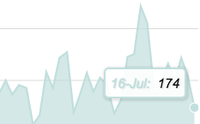
Following historic seasonal patterns, the U.S. ad marketplace crashed to its lowest point so far this year in July, but nonetheless showed gains vs. the same month in previous years.
Trading volume across all media fell to an index of 174 in July, down 30 points from a 204 in June, according to the latest monthly installment of the U.S. Ad Market Tracker, a collaboration of MediaPost and Standard Media Index, based on actual media buys processed by the majority of big agency holding companies and their clients.
While July historically represents a seasonal low point in terms of overall ad market demand, July 2016 was the highest recorded since SMI began benchmarking the marketplace in 2010.
According to SMI’s estimates, overall ad spending expanded 3% between July 2015 and the same month this year.
SMI attributed July 2016’s momentum to “healthy” national television sales, “despite some clear ratings challenges in prime-time and late fringe.”
On an absolute volume basis, national TV ad demand actually declined 1% in July — which, given the erosion in network TV inventory, likely means costs rose disproportionately. The Ad Market Index for national TV fell to its lowest index value since July 2011, when it stood at 101.
SMI and MediaPost are poised to reboot the index to include actual costs, as well as the proportion of national TV inventory comprised of audience deficiency units, or “makegoods,” based on modeling full market coverage. Currently, SMI aggregates data from all the major agency holding companies with the exception of WPP’s GroupM. The full market data will utilize a model to factor that.
Meanwhile, digital continues to be the most ascendant media, according to the current index. While digital’s index value fell declined 90 points to a 534 in July vs. a 624 in June, it was the highest July since the index was created.
On an absolute basis, digital’s trading volume expanded 12% year-over-year for the month of July.
In terms of category demand, the largest advertisers continue to expand overall spending relative to smaller ones. The index for the “Top 10” categories expanded 3% vs. July 2015, while the index for “All Other” categories declined 4% during the same period.
MediaPost.com: Search Marketing Daily
(15)