What Your Competition Doesn’t Want You To Know About Paid Search
by Richard Stokes, founder and CEO of AdGooroo, a Kantar Media company
Paid Search is usually a “winner takes all” affair.
In most product categories, there are a handful of competitors – often as few as two or three – who dominate paid search in a particular market. Most remaining advertisers are largely unaware of the dormant revenue opportunities which lie untapped.
Digital marketing follows what is known as the Power Law: a few products, people, and websites garner the bulk of market share, traffic and revenue. The large bulk of remaining advertisers— often referred to as the long tail—fight each other for whatever traffic remains.
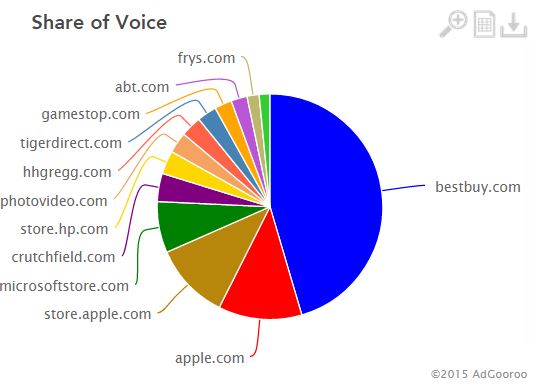
In multiple studies conducted between 2007 and 2014, AdGooroo has found that in virtually every product category, just 1-3% of advertisers virtually shut out their competitors from most of the available search engine traffic. This makes intuitive sense when one considers that the average product category has over 700 participants competing for just one of eleven available placements on the search results page.
Figure 1
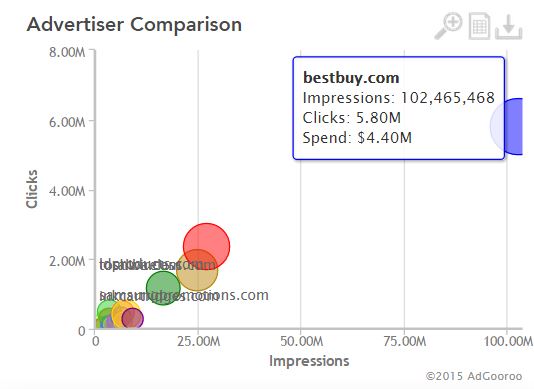
For example, Figure 2 below shows the relative paid search performance in the Consumer Electronics category in July 2015. The X-axis measures exposure (impressions) while the Y-Axis measures traffic (clicks). The size of the icons correlates to their ad spend. As you can see, Best Buy is the clear leader and is generating around 147% more paid search traffic than the Apple. Surprisingly, Best Buy pays around 32% less per click than Apple, and less than many other advertisers in the same category as well. The remaining 1,380 competitors in the Consumer Electronics category compete for a much smaller amount of leftover traffic.
This dramatic difference in paid search results between direct competitors—who are often selling the same products—goes largely unnoticed by digital marketers, particularly those who manage websites that span dozens of different product or service categories. This is sometimes due to a lack of category-specific reporting, but more often it stems from an over-reliance on traditional ROI metrics, which fail to measure hidden opportunity costs.
AdGooroo, Tuesday, October 18, 2016
(28)

 Figure 2