Data Shows Tablets Driving Highest Click-Through Rates
Data Shows Tablets Driving Highest Click-Through Rates
by Laurie Sullivan @lauriesullivan, December 20, 2017

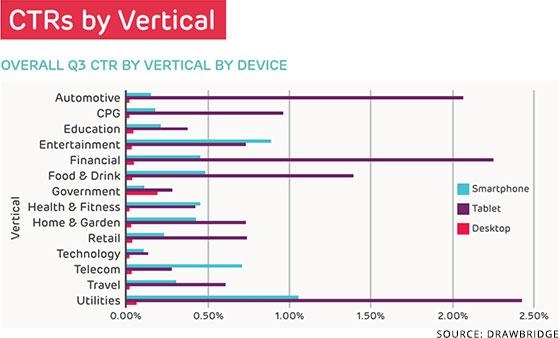
Tablet impressions drove 1.13% click-through rates that were the highest of any device in many categories such as Automotive, Consumer product Goods, Education, Financial, Food & Drink, Government, Home & Garden — and, yes, even Retail, Technology, Travel and Utilities.
The Drawbridge Q3 2017 Cross-Device Advertising Benchmark Report analyzes billions of impressions served from July 1, 2017, through September 30, 2017, across every vertical, device, and format to identify trends. The data notes the likelihood of the types of devices consumers will use to click through advertisements to the company’s landing page to complete a task or make a purchase.

Marketers that disregard targeting on tablets may want to rethink their strategy. The third-quarter numbers from 2017 released by Drawbridge on Wednesday show considerable gains on tablets, especially when comparing CTRs from advertisements served on desktops and smartphones.
“Tablets are not replacing desktops, which was once predicted,” said Brian Ferrario, vice president of marketing at Drawbridge. “If anything tablets are merging with phones. Every device is becoming mobile, and the trick is to be present when the consumer is.”
Creatives should not be limited to just a few formats that are presumed to be the highest-performing, he said. The more dimensions and formats the better, as it’s critical to get consumers’ attention at the right time with those incremental touches across devices, so you need to run the gamut with everything and optimize from there based on what’s working.
Desktop ads saw an overall CTR of 0.03% and smartphone placements drove 0.49% CTR, Interstitial ads on smartphone and tablet helped drive higher CTRs on those devices.
Smartphones did well in some categories like Entertainment and Health & Fitness, but for the most part consumers seem to prefer a larger screen. For example, the CTR for the Retail category hovered somewhere around 0.25% in third-quarter 2017 on a smartphone, but came in at about 0.75% on tablets.
Utilities drove the highest CTR on tablets at 2.42%. The highest percentage came in third-quarter 2017 at 0.96%. Ecommerce came in with a quarterly high CTR of 0.67% in second-quarter 2017.
Video completion rates were also high on tablets, more so than any other device during the third quarter of 2017. Rates hit a high of 73.98% in the first quarter of 2017, dropped to 59.30% in the second quarter and then rose to nearly 70% in third-quarter 2017. The completion rates were based on video starts of a combination of skippable and non-skippable ads in 20-, 30-, and 60-second formats.
While tablets held the highest video completion rates in the third quarter of 2017, smartphones saw the highest rates in the first quarter of 2017, with 75.79%.
MediaPost.com: Search Marketing Daily
(15)


