Datorama’s new LiteConnect automatically generates an interactive dashboard for standalone data
Employing the platform’s AI, the new feature lets marketers quickly analyze new data sets outside the overall campaign model.

Datorama’s platform helps marketers make sense of diverse data, providing unified insights across different data feeds from a campaign — Facebook spend/results, Twitter spend/results, website display ad performance and so on.
Last May, the New York City-based firm launched Datorama Genius, an additional layer of AI that automatically finds insights from data relationships, such as suggesting ways performance can be boosted. Previously, the platform’s AI was focused on foundational tasks, like organizing incoming data for data models.
A typical user might have somewhere around 70 streams of structured campaign data from such sources as ad analytics or marketing tools. The platform is designed to turn that marketing data into usable intelligence, such as generating Key Performance Indicators or showing the impact of one set of ad results on overall sales.
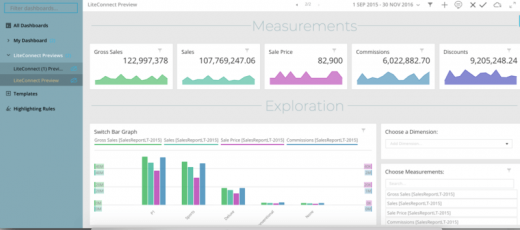
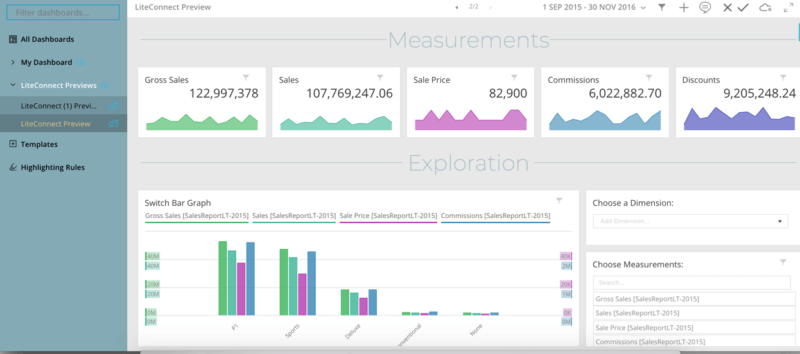
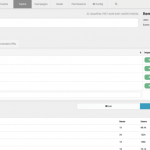
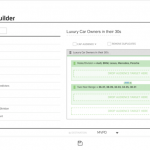
This week, the company is adding another capability to its AI’s job description. It is launching LiteConnect, which employs AI to turn a standalone data set into a separate interactive and marketing-specific dashboard. This might be an unconventional source of data that is not part of a campaign, such as weather data versus foot traffic for various locations of a restaurant chain. Here’s a sample LiteConnect dashboard:
A marketer might upload a spreadsheet or other data file by dragging and dropping its icon onto the LiteConnect upload screen. Instead of integrating the limited data into the ongoing view across campaign data, the marketer might want to quickly analyze the specific data set by itself. CMO Leah Pope told me a marketer could have set up a standalone dashboard previously, but it required a more involved setup.
LiteConnect will automatically create a smart dashboard with visualizations and data relationships, such as overall trends, Key Performance Indicators or the impact of rain on restaurant sales, as determined by the platform’s AI.
Initially, the visualizations are based on data relationships, like one factor’s impact on another. But a marketer can link one element in the new data set to the overall data model if desired, so that a factor like weather/foot traffic becomes integrated with the overall campaign intelligence as the AI learns the patterns.
Marketing Land – Internet Marketing News, Strategies & Tips
(55)

