Delta variant update: This map shows the 5 most and least vaccinated states as U.S. cases rise
The highly transmissible Delta variant is now the most dominant strain of COVID-19 in the United States. As Healthline reports, CDC data for the two weeks ending July 3 shows the Delta variant now makes up 51.7% of all COVID-19 cases. That’s a far cry from mid-June when Delta only made up 10% of cases in the U.S.
The good news is, all three approved COVID-19 vaccines—Pfizer, Moderna, and Johnson & Johnson—are still highly effective at preventing hospitalization and death from the Delta strain. The bad news? Most states aren’t anywhere close to being where they need to be when it comes to having a majority of their population fully vaccinated.

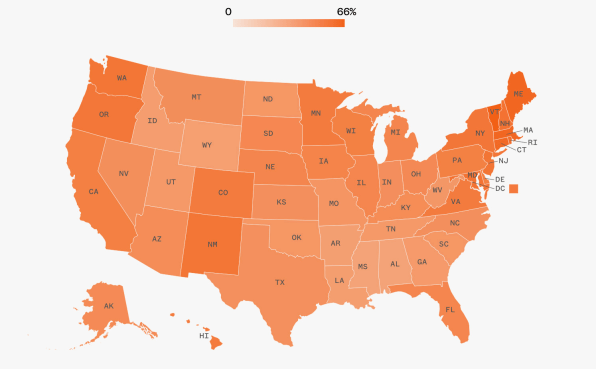
The map above tracks data about vaccination rates across the U.S., according to NBC News. The broadcaster says that as of July 12, 159,266,536 Americans have been fully vaccinated. Yet as NBC’s map shows, some states are clearly doing better when it comes to the percentage of their populations fully vaccinated.
According to NBC’s data, the states that have the highest amount of their population fully vaccinated are:
While those states deserve praise for their vaccination rates, it must be noted that even the top five haven’t reached the 70% to 85% of the population threshold that needs to be vaccinated to achieve herd immunity.
Yet other states are doing much worse. These are the five states with the lowest vaccination rates:
You can check out NBC News’ full map here to see how your state or territory is doing. And as for what you can do to improve the situation? Get fully vaxxed, continue social distancing and wearing face masks, and encourage your friends and family to do the same.
(33)


