For Your Next Adult Coloring Book, Shade In Data On Climate Change
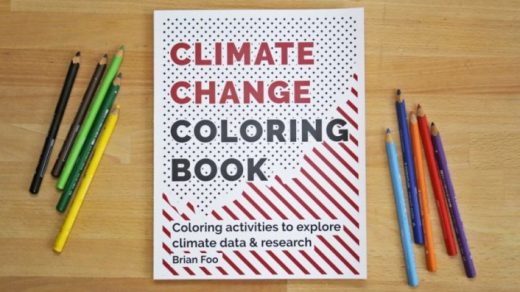
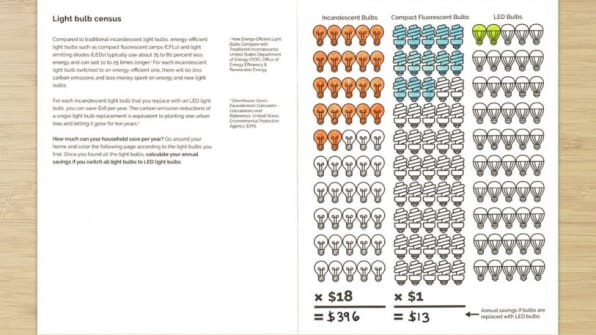
In a new coloring book, you can trace a line around the border of arctic sea ice in 1996 and shade in what has been lost since then–an area the size of India–or you can color-code each day of 2015 based on the level of air pollution in Beijing. You can also color in coastlines to show the land that will be lost to sea level rise, or challenge yourself to color in 20 football fields in a minute, the rate at which global forests are disappearing.
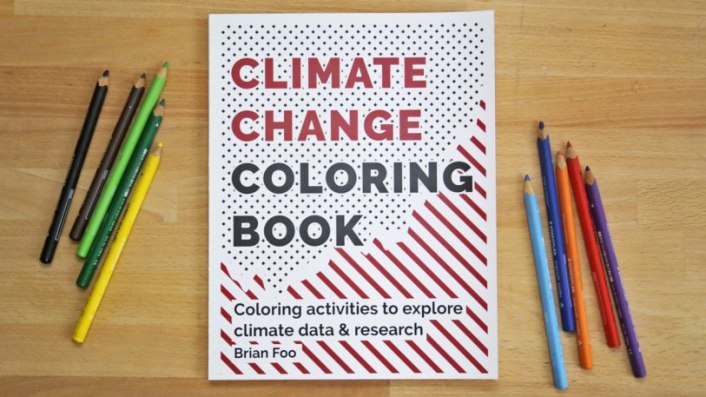
“I thought it would be interesting to see what would happen if you juxtaposed something that was calming and creative like coloring with something that was urgent and possibly anxiety-inducing like climate change,” says designer Brian Foo, who created the Climate Change Coloring Book, now on Kickstarter.
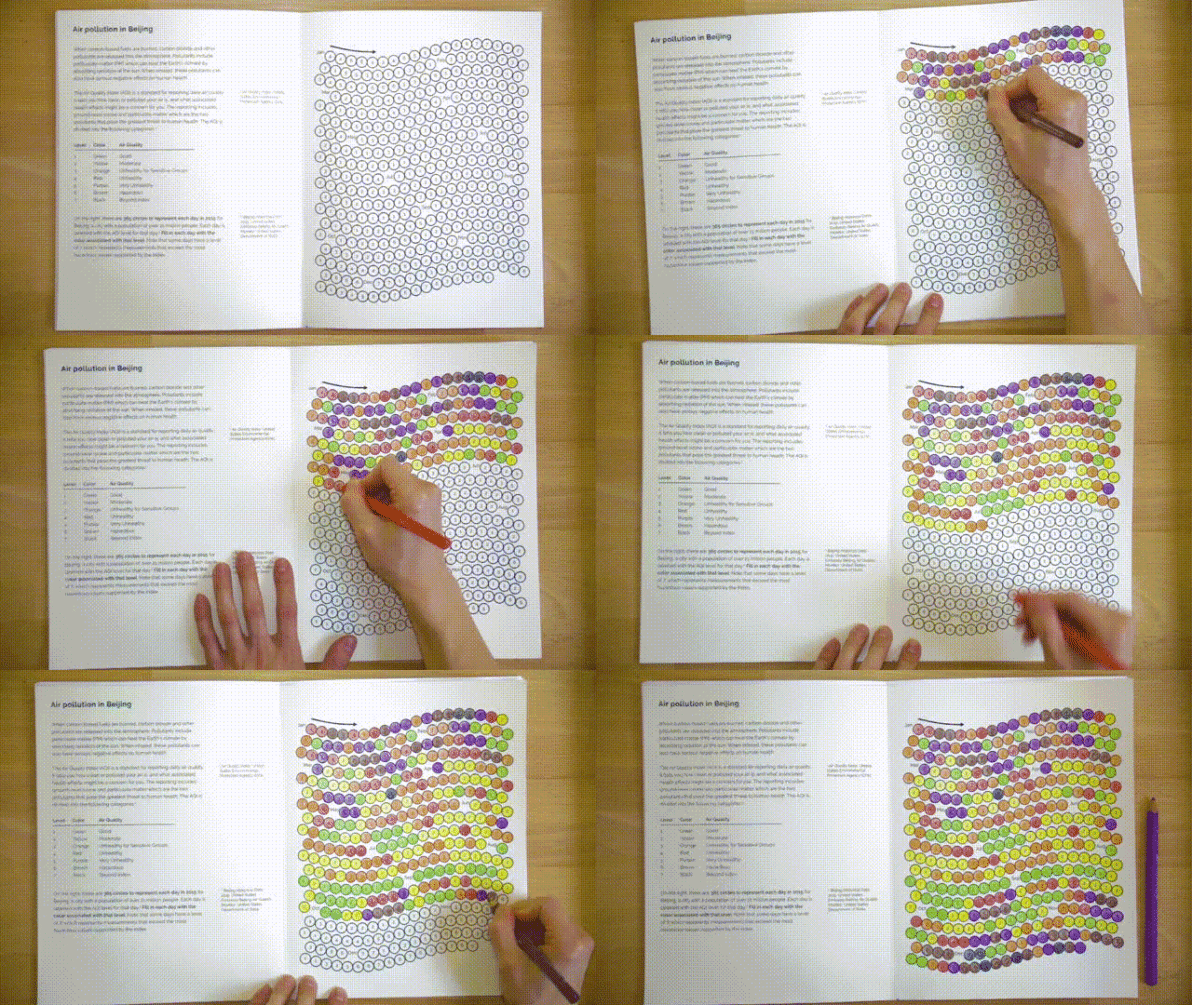
“The hope is that if you spent 30 minutes or an hour actively coloring data related to climate change, the information would be more likely to stick and you’d have time to reflect on the underlying issues,” he says. “Even though a chart or graph may give the information more quickly, it may be less likely to leave an impression.”
The data covers the causes of climate change, including deforestation and emissions from transportation. It also includes the effects of climate change, from sea level rise to bleached coral reefs, and solutions like renewable energy. One illustration juxtaposes scientific consensus–the fact that virtually all researchers agree that human activity causes global warming–with public opinion (in a 2016 poll, a little less than half of Americans agreed with that consensus).
Foo hopes that the book is seen as a celebration of information and science, not a political statement.
“Over the past few years, I have been surprised that the issue of climate change has become so political,” he says. “I think that one of the problems is that climate change is now treated as a belief. Either you believe in climate change or not. When in reality, climate change is based on observations, science, and the scientific method. I wanted to design guided activities that focused on the data and science in an approachable way that would allow someone to take the time to come to the conclusions that climate scientists have come to.”
(51)

