Columnist Kyle Blanchette notes that after Google’s recent update to the Search Analytics report in Search Console, many of Merkle’s clients saw a significant increase in the total number of keywords reported per day.

Webmasters may have had a moment of panic in the days after Google made an update to the way impressions and average position are reported in the Google Search Console interface.
Quite a few of our clients at Merkle saw significant drops in average position after the update, like this one:

Once Google confirmed the July 13 update and added it to their Search Console Data Anomalies page, there wasn’t much to go on when trying to determine exactly what happened. The update was described as such:
An incremental improvement in Google’s logging system now provides better accounting for results in lower positions…
This leaves a lot to be desired when searching for answers to what changes really occurred and why our reports are now so much different.
In this article, we explore one of the changes in our clients’ Search Console data that might explain at least part of why the change was so drastic.
What really happened?
Given that the GSC interface is limited to only export 1,000 rows per report, we turned to the Search Analytics API, which allows us to pull a more complete data set and get a better look at where the drop in average position is coming from.
We already know what happened (or didn’t) with the standard engagement metrics of Clicks, Impressions, CTR and Average Position, so we looked to another metric that might hold some answers: the total number of unique queries pulled in with the API per day.
Some of our largest clients see upwards of 15,000 unique queries stored in our database per day, with a median of about 4,000 unique ranking queries per day.
The data
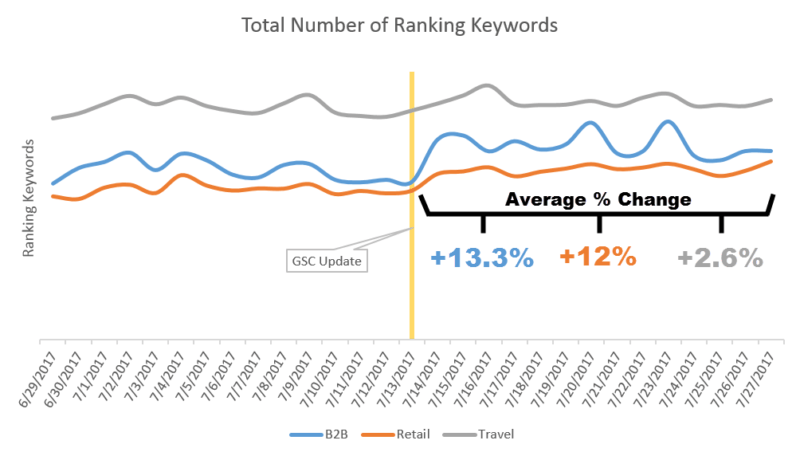
To ensure the most complete data set possible, we chose three sites from three different verticals that were closest to the median number of ranking queries per day across all of the sites for which we store Google Search Console (GSC) data.
Two of the three sites saw a clear and consistent increase in the number of ranking keywords pulled from the API per day. For the third site, while the average number of ranking queries per day increased after the update, the increase is less clear:

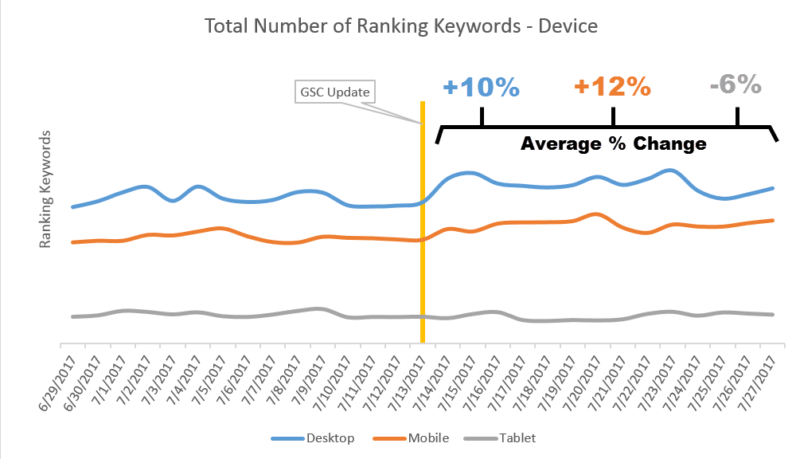
When aggregating the number of ranking keywords pulled from the API per day across all three sites and segmenting by device, the increase is similarly clear on both desktop and mobile.
Curiously, there was a slight decrease in the number of keywords pulled in by the API per day on tablet devices, which naturally sees far fewer keywords per day than other devices; it’s possible that while the average percent change was larger than expected, the total change may not have been as significant.

Given the limited information Google shared with us on the details of the update, our first assumption was that Google is now tracking significantly more keywords that are ranking extremely low — which, in large enough volumes, would pull down average position across the site.
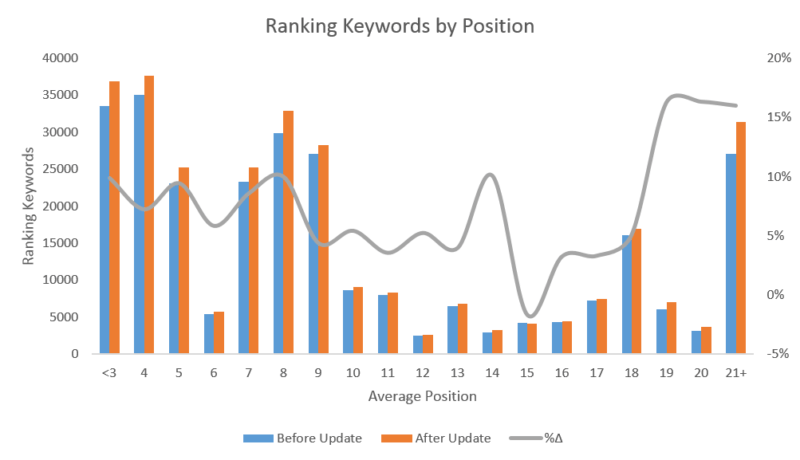
Surprisingly, our data tells us otherwise:

While there was a clear increase in the number of queries with an average position past the first page of results, there was also a significant increase in the number of queries reported ranking in position 10 or better.
On average, the number of queries ranked in position 10 or better increased after the update by about 7.1 percent. In contrast, the average number of keywords reporting in position 11+ increased by 7.8 percent.
Takeaways
- The average position reported in the GSC interface is a weighted average, giving more weight to queries that have more impressions. Our data, although slightly anecdotal, suggests that Google may be reporting on more queries regardless of rankings, not just more low-ranking queries, which helps to explain the more drastic drop in average position.
- Take a look at your own site to see how the data actually changed, not just how it is reported in the GSC interface. If you don’t currently have a solution to pull data using the Search Analytics API, try using Google’s API explorer.
- For individual query-level average position, nothing should change in the way you do your analysis. As Google mentioned, your average position didn’t actually get worse, they just made a change to the way it is reported.
- Looking at the types of new queries that are ranking after the update, there doesn’t seem to be a specific pattern or format, there is simply more volume. (Apologies to those who really wanted it to be voice search data, but we didn’t see any evidence to support that.)
[Article on Search Engine Land.]
Some opinions expressed in this article may be those of a guest author and not necessarily Marketing Land. Staff authors are listed here.
Marketing Land – Internet Marketing News, Strategies & Tips
(49)
