How to track wildfires in California, Oregon, and across the U.S. with Esri’s new mapping tool
Wildfires raging across the American West have grown worse in recent years, in a phenomenon most scientists ascribe to climate change. In late July, California’s biggest blaze yet this year, the McKinney fire, ignited near the Oregon border and torched more than 55,000 acres of national forest in less than a weekend. Subsequent rainfall over patches of scorched earth has led to flooding and debris flow, which damaged local infrastructure and killed tens of thousands of fish in nearby rivers. The fire, meanwhile, is still burning.
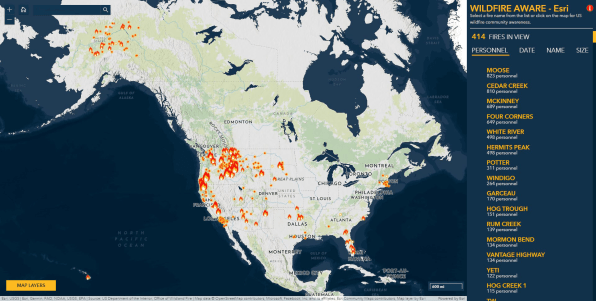
Now, as wildfire season heads into its peak—in late summer and early fall along the West Coast—web cartographers at Esri have created a new browser app, Wildfire Aware, which tracks wildfires across the country and reports on their impact to people, property, and the natural world.

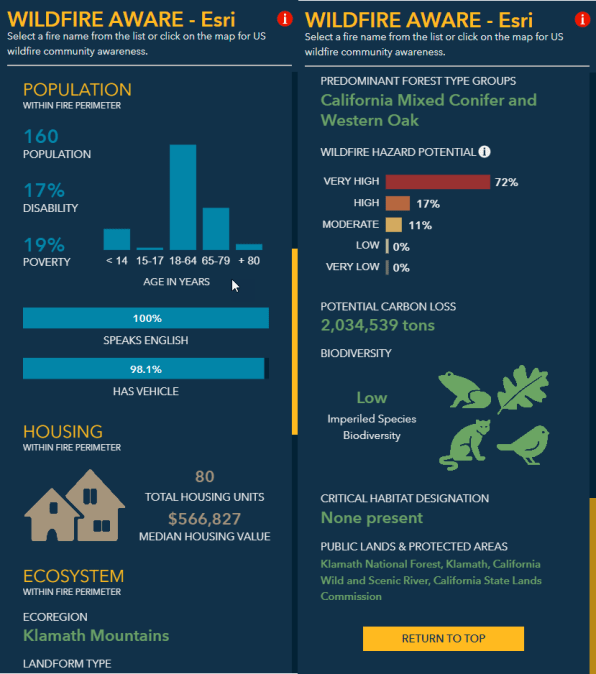
The app synthesizes data from a staggering 22 different agencies, including the Environmental Protection Agency (EPA), NASA, the National Weather Service, the U.S. Census, and the U.S. Fish and Wildlife Service. Within each agency, wildfire impact is typically viewed through its own unique prism lens; but by layering all of the data within its app, Wildfire Aware serves as a sort of mission control for wildfires. On the app, people can zoom into the interactive map to see fires by location; the map can also be toggled to show thermal hot spots, air quality, and population density.

For each fire, users can scroll through side-by-side trackers that show how long the fire has been burning, how much acreage it has burned, how many personnel have been deployed, and what percent contained it is, as well as other data, including what type of landform it covers, how much biodiversity is present, and how much carbon could be lost.
The app was developed using Esri’s ArcGIS API, and its source code can be downloaded on Github.
(17)


