How to Use Mobile App Analytics to Clearly Understand Your Customers’ Needs
How to Use Mobile App Analytics to Clearly Understand Your Customers’ Needs

Downloading your app is only the first step users take and it doesn’t necessarily mean more business for your company.
Focusing on providing a positive and seamless buyer journey is the key to more conversions and higher sales. If you want consumers to use your app, be sure it addresses their concerns or needs. Use mobile app analytics to optimize your customers’ experience.
Customers expect convenience and faster access to information than ever before. They demand instant access as well as the ability to explore options from wherever they are. Companies must design smarter apps to provide the data necessary to understand user behaviors and optimize processes.
To meet these needs, the fields of mobile and web development are growing rapidly. The U.S. Bureau of Labor has forecast that the developers’ job market will increase by 15% by 2026. If you need to hire someone to create your app, you might want to start searching for a good dev now.
What Defines a Successful Mobile App?
The number of installs, clicks, and ratings play a significant role in your app’s success. However, it is more critical than users clearly understand your apps’ main value proposition.
For example, fintech stocks have become extremely popular during COVID-19, as many people turn to day trading or various forms of online trading to supplement their income. To do that, they need a mobile trading app. If you want your app to be successful, it must be clear how it is superior to all the other competitors.
Look for indications that potential users are arriving from comparison posts like this one or online reviews. Also, look for visitors who exit to visit comparisons or reviews. If this type of content impacts your app’s success, you may need to focus on improving your app’s online presence.
You can do this by contacting the authors and giving them additional information about your app, making it easier for users to review it or encourage other content to be written.
Another example is the use of apps in the healthcare industry. During the pandemic, patients can communicate with and even have telehealth visits through mobile apps.
Both these examples require strong trust signals and security options, or people will not use them. Use your mobile app analytics to improve if you see indications that people are abandoning your app over trust issues.
What is Mobile App Analytics?
The process by which data is analyzed and measured about users to gain insights into how they behave is known as analytics. Mobile app analytics refers to the same process, except the experience takes place on a mobile device. They play a crucial role in helping brands understand how their mobile app is working for prospective customers.
Also, mobile web analytics can help you identify areas or steps that need improvement. The buyers’ journey consists of multiple data points that can be examined to determine where users interact with your app.
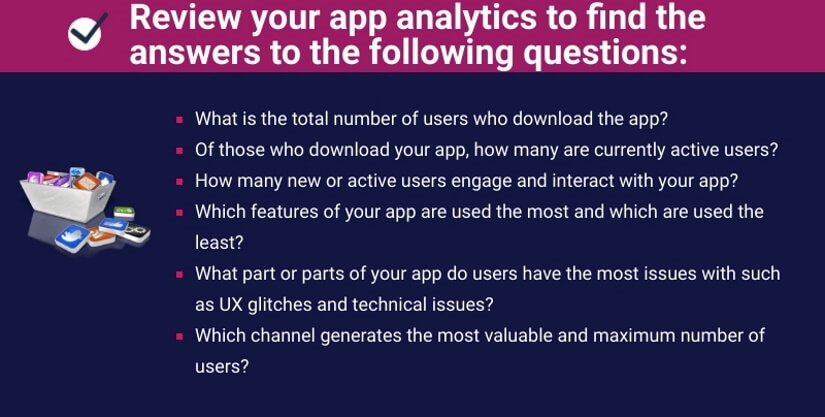
Review your app analytics to find the answers to the following questions:
- What is the total number of users who download the app?
- Of those who download your app, how many are currently active users?
- How many new or active users engage and interact with your app?
- Of all the features of your app, which are used the most and used the least?
- What parts of your app do users have the most issues with, such as UX glitches and technical issues?
- Which channel generates the most valuable and maximum number of users?
Why Use Mobile App Analytics?
Creating an app requires you to spend a lot of time and resources. If you think users will immediately find your app, download it, and start making purchases, you are kidding yourself. Without mobile analytics to understand how consumers interact with your app, you are just guessing or assuming you know what potential customers want, need, and expect.
Reviewing analytics provides invaluable insights to make the necessary improvements to your app. Use the information you gather to devise actionable steps such as adding, removing, or improving an existing feature and changing the app’s flow if the data you collect supports it.
Mobile analytics will also enable you to audit your advertising campaigns and identify which metrics provide the most success.
Which Metrics are Useful?
You can use several metrics to improve the user experience and your app’s performance. Therefore, it is critical to identify your key performance indicators (KPIs) to know which metrics should be your focus.
Single metrics can be combined with others to get more information about the customer journey. Below we will focus on specific metrics and what you can learn from them.
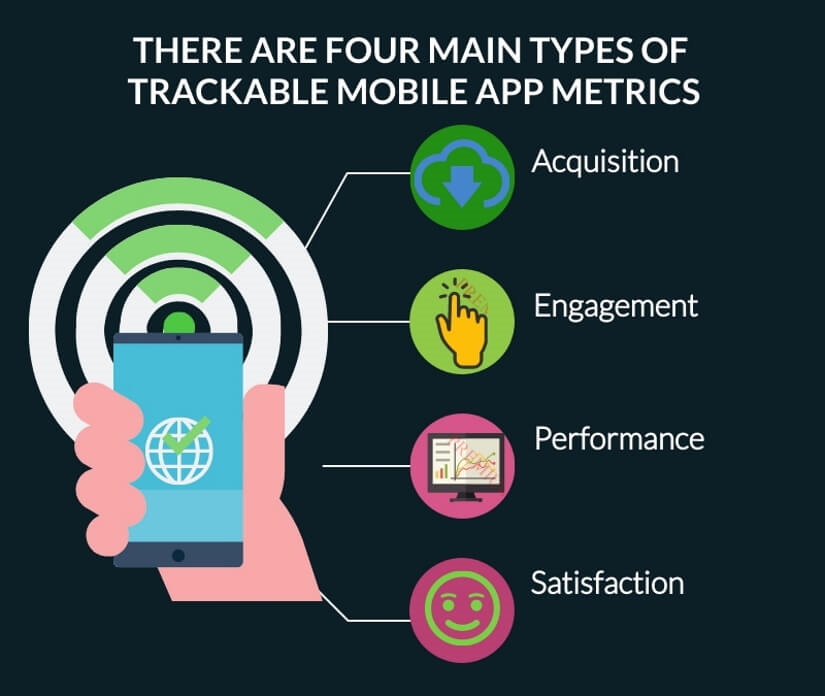
There are four main types of trackable mobile app metrics that we will describe in more detail below:
- Acquisition
- Engagement
- Performance
- Satisfaction
Mobile App User Acquisition Analysis
The first step in an app user’s buyer journey is to download it. The data derived from user acquisition analytics gives you information about how users find your app, the most popular operating systems, devices used, and the total number of new users.
Below are specific metrics that measure user acquisition.
App Attribution Metric
See how you acquired your users and whether they found you organically or through paid advertising. The attribution metric lets you track the sources that lead users to your app.
Measure how your campaigns are performing to determine which are worth investing in and which are not.
For example, set up a link to a campaign you are running to track who:
- Sees your app
- Taps on it
- Installs the app
- Purchases your app
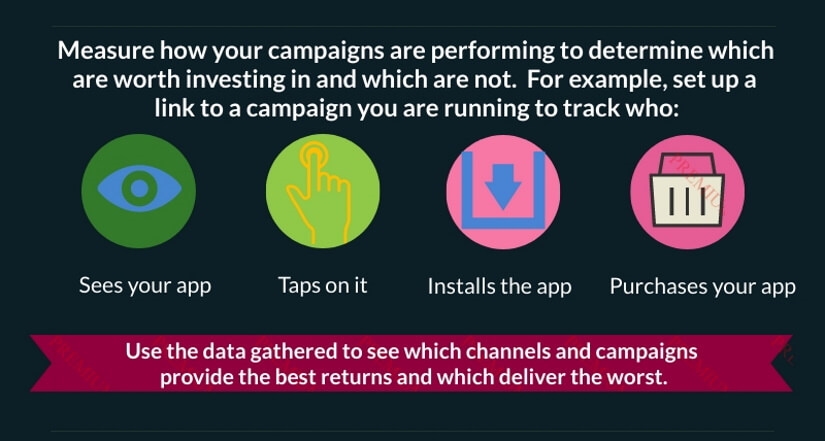
Use the data gathered to see which channels and campaigns provide the best returns and deliver the worst. Focus your resources and time on the marketing initiatives that are bringing in the best results.
Average Revenue per User (ARPU)
This metric shows you the amount of revenue, on average, generated for each active app user. Use it to measure how close you are to hitting your target revenue.
To calculate ARPU, divide the total revenue generated in a specific time, such as a week, month, or quarter, by the total number of active users during the same time frame.
For example, if your app generated $ 600 last month and you had 6000 active users, the ARPU would be $ .10. This metric’s value is to help determine the ROI of your campaigns and calculate the lifetime value of your users.
Look at the ARPU trends over time to evaluate your pricing structure and adjust it up or down depending upon the data you collect.
Be sure to track ARPU in conjunction with other metrics such as total revenue and the ratio of Lifetime Value (LTV) and Customer Acquisition Cost (CAC) to get more reliable results.
If you have a subscription app with no other in-app purchases, there is no need to calculate the ARPU because the subscription price predetermines it.
Customer Acquisition Cost (CAC)
See how much money you spend to acquire a new customer from getting their attention to getting them to make a purchase. Calculate CAC by dividing the total cost of a campaign by how many buyers it brought in.
This metric lets you calculate ROI. It is critical because it enables you to identify the best performing and most cost-effective methods of acquiring new users.
If you see a reduction in new customers, you should use this metric to track and optimize your ROI. Spend more time and resources on the campaigns with the lowest acquisition costs.
Lifetime Value (LTV)
LTV refers to how much you expect a user to spend before they stop using your app. It is also known as churn or attrition rate.
This information is vital because it lets you know long a user needs to remain active before they generate their maximum revenue.
You will also get an idea of how much you can expect to make from your app. Focus on optimizing the user experience to identify where and why people stop using your app to increase LTV.
Metrics for User Engagement
There is not a single metric to measure app user engagement. How users engage with your app and what activities they perform determines the success rate. Below are the most critical measurements to assess user engagement.
The Number of Downloads and Installs
Getting a substantial number of downloads plays a significant role in your app’s success and is the first step in the buyers’ journey.
However, keep in mind that just because someone downloads your app does not mean they will install or use it.
The more downloads you get, the better chance of broadening your active users’ base, so this is still considered an important metric.
Tracking and understanding installs’ source enables you to evaluate your advertising channels’ effectiveness and your marketing campaigns’ efficiency.
Event Tracking
Event tracking provides insight into each user’s in-app experience. Use the analytics to see exactly what each user is doing while they are using your app.
For example, you will see which button users click on each step of your funnel. Use the information you collect to obtain actionable data to improve your app’s performance and user experience.
Some of the critical in-app behaviors to measure include:
- Which pages or steps they visit
- What they purchase
- Which stage of your funnel leads to a sale
- How often a user adds an item to their cart
- Whether users complete their purchase or abandon their cart
Understanding how users interact with each stage of your funnel will identify which steps are losing users and which need to be optimized for less attrition.
Tracking Sessions
A session is when a user installs, opens, and engages with your app. The session data lets you know how often users open your app and their progression through your funnel.
Look at the sessions by location, time, and device. These metrics will show you when, how, and from where users access your app.
Get an idea of how many sessions, on average, it takes for a user to complete a purchase.
Churn Rate
When a customer or subscriber does not renew, cancels, or stops using your product, it is referred to as customer churn. The churn rate shows you how many of your users have abandoned your app. It could be that they are no longer using it or uninstalled it. The app churn rate is a vital metric that enables you to determine LTV. It also allows you to identify the funnel’s reasons nd steps where users lost interest in your app.
For example, if you see a high churn rate occurring after installation, your onboarding process could be cumbersome, or there might be a technical issue you need to address.
High churn rates might also indicate that your outreach and marketing initiatives are not attracting the right audience. If you find that users are dropping out after using your app frequently, try to re-engage them with incentives and other personalized messaging.
Retention Rate
The app retention rate is a companion metric to churn. It measures how many users continue engaging with and returning to your app. Higher retention rates equal more revenue. The longer your users stay, the more value they add to your business.
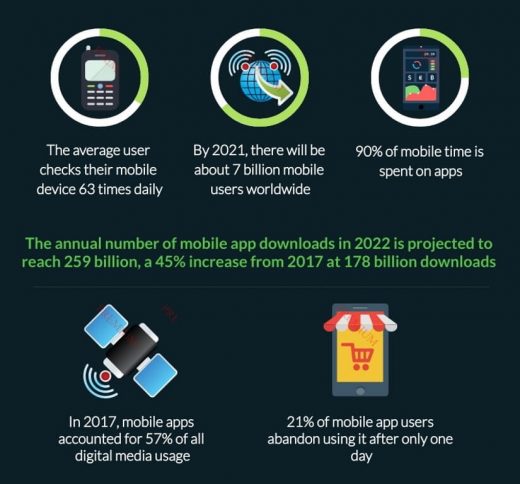
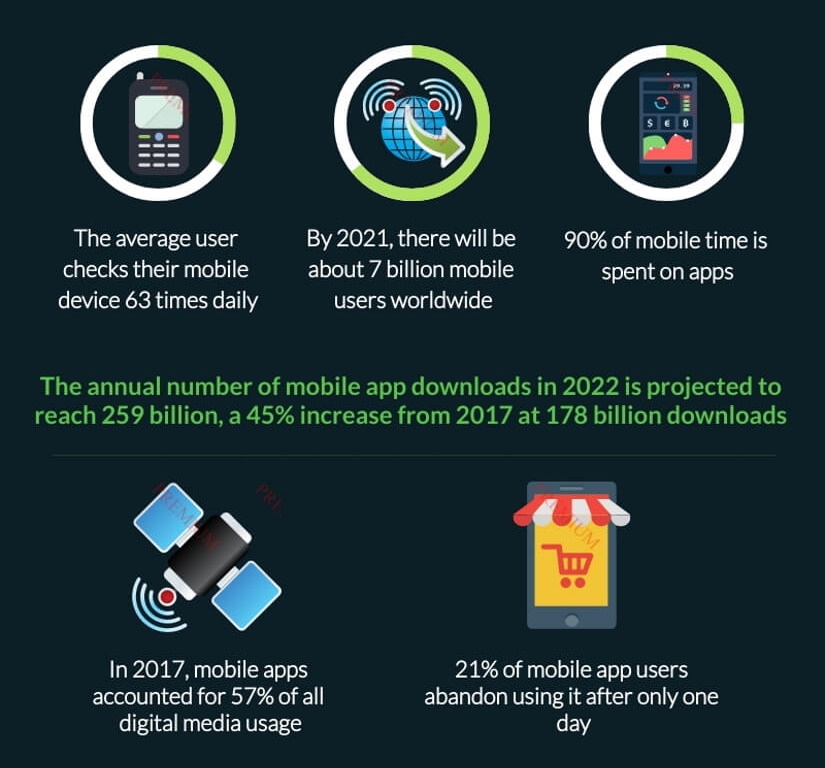
The average consumer has numerous apps installed on their phone. The number and usage of apps are increasing at a rapid rate, as seen in the statistics below:
- The average user checks their mobile device 63 times daily
- Statista predicts that by 2021, there will be about 7 billion mobile users worldwide
- 90% of mobile time is spent on apps
- The annual number of mobile app downloads in 2022 is projected to reach 259 billion, a 45% increase from 2017 at 178 billion downloads
- In 2017, mobile apps accounted for 57% of all digital media usage
- 21% of mobile app users abandon using it after only one day
The longer consumers use your app, the more opportunity there is for it to be successful. Therefore, retention is a crucial metric. Your app must be more than intuitive and usable. It needs to offer users what they want and need. Use analytics to identify where users drop off.
Look at daily, weekly, and monthly tracking data and compare it to the marketing campaigns running simultaneously—track user retention metrics to identify precisely where users are dropping off in the buyers’ journey.
App Performance Metrics
To grow and be successful, use your mobile app analytics to gain valuable feedback and insights. How your app performs from a technical and marketing perspective relies heavily on metrics and analytics.
Use these metrics to identify any roadblocks that interfere with the quality of the user experience.
Load Speed
Everyone today is in a hurry, and no one wants to wait, especially for a slow application to load. Test your app to ensure it only takes a few seconds or risk users abandoning or uninstalling it.
Screen Resolution
The screen resolution metric is more useful for Android apps than iPhones because they come in various resolutions and sizes. iPhones have a limited number of models.
When you know which resolutions are more popular amongst your users, you can focus more on quality assurance for that resolution.
App Crashes
Crashes measure how often your app abruptly closes while a customer is using it. Ideally, it is best to test during the development process to identify issues before you go live.
Study your crash reports to see exactly at which point the app crashed and what caused the problem. These reports are essential for identifying technical issues, testing, and fixing your app.
Operating Systems and Devices
See which devices and operating systems your target market uses. You can use this data to offer more personalized offers.
App Latency
The time it takes your app to request and receive a response from an API is called app latency. It is as important as speed and requires regular monitoring to ensure short wait times on multiple operating systems versions.
Be sure that your APIs are optimized and follow best practices on the server-side.
User Satisfaction Metrics
Satisfied and happy customers stay, but more often, and make recommendations to friends and family. Below are several metrics to identify your users’ level of satisfaction.
Heatmaps
Heatmaps will show you which areas of your app funnel are getting the most interactions and which are getting the least. Use this information to add features that are more engaging to the area receiving less traction.
App Reviews and Ratings
App ratings and reviews are the easiest and quickest method to get feedback from your users. Many consumers look at how others rate an app before deciding to download it.
Reviews play a critical role in how your app is ranked. Keep in mind that people are more likely to share negative feedback than positive ones. It is just human nature.
However, even negative feedback can be a source of learning by improving your app and user experience. Do you best to keep your users satisfied and happy by providing a seamless customer experience.
Net Promoter Score (NPS)
The NPS metric is a scoring system that quantifies how much a user likes or dislikes your app. Responses are usually graded on an 11-point scale from 0 (not likely) to 10 (extremely likely). It is also a customer loyalty metric. NPS measures how likely a customer is to recommend your company to a friend or family member.
You can use the data you collect from the NPS to direct your marketing campaigns, improve your app’s performance, and increase customer satisfaction.
In-App Feedback
In-app surveys can provide crucial data about your users without the need for them to leave your app. There are several ways to collect feedback from your users, including contact forms and surveys.
Use Mobile App Analytics to Your Advantage and Follow Best Practices
Both large and small companies benefit greatly from creating a mobile app. There are plenty of mobile app-making software options if you want to create your own.
Your business will reap the rewards of creating a mobile app for your customers by:
- Providing your customers with more value
- Connecting better with your customers
- Building a stronger bond
- Boosting profits
Get a better understanding of your app user’s journey from the metrics discussed above. Use the data you collect to make informed decisions to improve the customer journey and generate more revenue.
Below are some mobile app analytics best practices:
- Test on as many devices as possible
- Give priority to the app onboarding experience.
- Use the data from your app analytics to try new initiatives.
- Improve conversion rates by using A/B testing
Do not waste your time on metrics that do not matter to your goals. Identify the measurements most aligned with your business objectives.
Use the data-driven analytics you capture to understand customer behavior, predict likely market trends, and align your marketing initiatives with your customers’ expectations.
The post How to Use Mobile App Analytics to Clearly Understand Your Customers’ Needs appeared first on ReadWrite.
(39)

