Microsoft Clarity Debuts As Free Analytics Tool With Heat Maps
Microsoft Clarity Debuts As Free Analytics Tool With Heat Maps

Microsoft on Wednesday released a free analytics tool it calls Clarity that has been in beta for two years. The technology has several features revolving around heat maps that aim to help website managers better understand website visitor behavior.
Employees at Microsoft initially used the tool. Now Microsoft is extending it to companies, mainly to help them build a user-friendly website that is a privacy complement.
Clarity — designed to have a low impact on page-load times and there are no caps on traffic no matter what the number of visitors to the website — helps give marketers a deeper understanding of why at website performs one way and not another.
It also provides anonymized heat maps and data that show where site visitors clicked and scrolled, and enables marketers to analyze use behavior on the website exactly as it happened through a job description code. Some of the data includes the name of the browser, and whether they are using a PC, tablet or mobile phone to access the site.
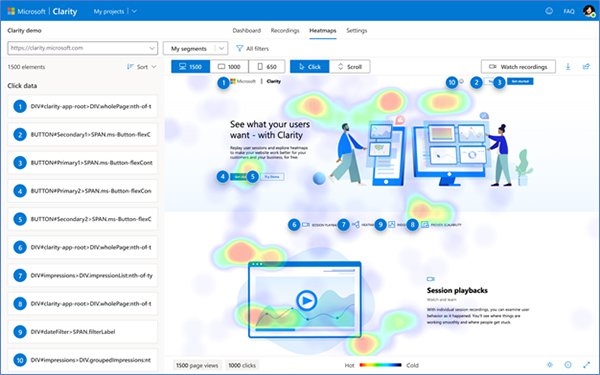
Heat maps provide a visual way to examine large numbers of site visitor interactions. Microsoft built two types: click maps and scroll maps.
While the heat maps tell marketers which pages get the most clicks, the click maps tell marketers what website page content visitors interact with the most. Areas in the map marked in red have the highest frequency of clicks and are usually centered on focal points.
These align with portions of the site marketers want visitors to click on. If they don’t, modification can be made.
Filters allow marketers to segment recordings. Machine learning gives marketers insight into patterns in session recordings including “rage clicks,” “dead clicks,” and “excessive scrolling” — all used to clarify and classify sessions.
Reporting also includes “Rage clicks,” which are behavioral patterns where site visitors click several times on a portion of a web page they believe should hyperlink somewhere, but do not.
These repeated clicks can be a good indicator of non-intuitive portions of the web page or can help to identify clicks that do not work, but should.
A dashboard of aggregate metrics provides an understanding of overall traffic patterns on the site. It shows where people click on nonexistent links or how many scrolled up and down a page in search of something they could not easily find.
It also tracks concurrent javascript errors and how much time visitors spend navigating the site.
Microsoft says the platform is compliant with General Data Protection Regulations.
(19)


