Omicron in the U.S.—this CDC tracker and map shows where it’s spreading
With a little over a week until the Christmas holiday comes into full swing, the new omicron COVID-19 variant is continuing its march across America. But while omicron is getting all the headlines due to its rapid spread overseas and a dearth of hard information about it, the primary COVID-19 variant of concern to America remains the delta variant.
That being said, from what scientists can tell from early data, omicron appears to be more transmissible than delta–which means it may be able to rapidly overtake delta as the key variant to be concerned with in the U.S. as December turns into January.
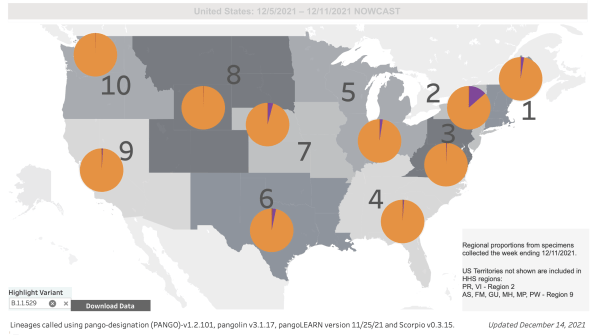
How widespread is omicron now? The CDC has an excellent tool that breaks down the prevalence of COVID-19 in America based on variants. (Note that the tool shows estimates based on sequencing data.) The most recent data comes from December 11, 2021, and shows that delta is 96.7% of all cases. Omicron accounts for just 2.9% of cases.

Now for the depressing news: Just a week earlier, on December 4, 2021, omicron accounted for only 0.4% of cases, meaning that in just seven days the new variant has spread rapidly. But where is omicron the worst in the United States? The CDC’s Nowcast map shows that on December 11, 2021, the Northeastern U.S. was being hit the hardest, with 13.1% of all Covid-19 cases there being the omicron variant. The next-worst area of the country was the midwest with 3.9% of all reported cases being omicron.
Again, however, due to the variant’s apparent transmissibility, the CDC’s map–and thus omicron’s impact on certain parts of the country–could change rapidly in the days ahead.
(19)

