Pharma’s Digital Ad Spend Tops 50% For First Time
Pharma’s Digital Ad Spend Tops 50% For First Time

As linear TV viewing continues to drop — an estimated 6.4% this year, according to Insider Intelligence — pharma brands are following suit, albeit at a slower pace than other ad categories.
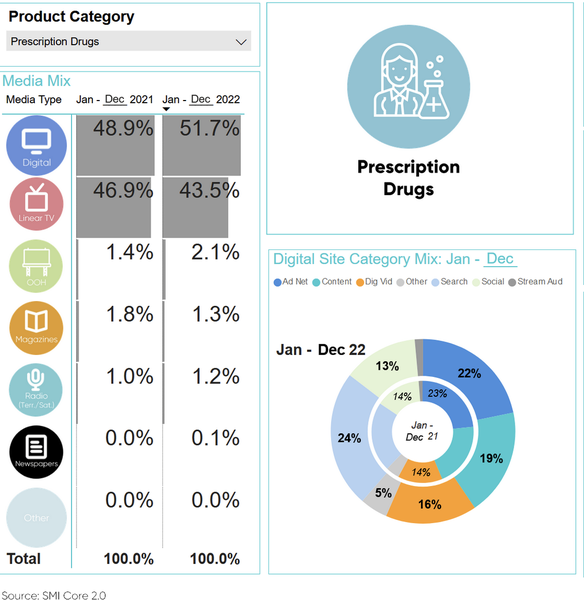
Standard Media Index (SMI) reports that, for the first time, digital media in 2022 accounted for over half — 51.7% — of all prescription drug ad dollars spent, up from 48.9% a year earlier. Over-the-counter (OTC) drugs had crossed the same 50% digital threshold a year earlier.
Meanwhile, linear TV buys fell to 43.5% from 46.9% overall,, says SMI, which captures invoicing data from agencies representing about 95% of all national brand ad spend
Digital spending rose 8%, to $6 billion of combined pharma/OTC drug advertising in 2022, while linear TV dropped 4% to $5 billion, Darrick Li, SMI’s vice president business development and strategic partnerships, North America, told Marketing Daily.
Pharma/OTC, however, pulled back from linear TV spending at a much lower clip than the entire ad industry’s 9.6% decline.
In 2022, pharma/OTC was the second highest spending category in linear TV, with a 14% share of all spending, behind only CPG, with a 16% share, and ahead of technology, with a 12% share.
Pharma’s pullback in linear TV correlates with a rise in CPM rates. While the average broadcast CPM for 25- to 54 year-olds in 2022 was $37.12, Li noted, pharma/OTC advertisers were paying $37.32. And in 2021, pharma’s rate had been $34.54.
In digital spending, pharma/OTC was #3, with 11% of all spending, behind CPG, with 20%, and tech, with 15%.
In all media, pharma/OTC was #3 in 2022, but supplanted tech at #2 in January 2023, the only month for which SMI has so far released data this year. “With the economic uncertainty, technology brand advertisers perhaps are pulling back a little bit faster than pharmaceuticals,” Li explained
Pharma ad spending in all media rose 2% for 2022, while OTC spend was up 7%. But pharma brands outspent OTC brands at about a nine-to-one clip, a trend that has been accelerating. In 2018, Li said, OTC accounted for 18% of all pharma/OTC spending, but this year only 11%.
Pharma’s digital mix was led by search, with 24% of the total, followed by ad nets with 22%, content ads with 19%, digital video 16%, and social 13%.
Among other media, out-of-home’s share of pharma spending rose from 1.4% to 2.1%, magazines dropped from 1.8% to 1.3%, radio rose from 1.0% to 1.2%, and newspapers crawled out of the abyss, going from 0.0% to 0.1%.
In 2022, OTC spending’s digital share was 55.0%, up slightly from 2021’s 54.8%. Linear TV buys, though, also increased slightly, from 42.2% to 42.4%, as numbers for other media got even lower: magazines from 2.0% to 0.9%, out-of-home from 0.5% to 0.4%, and radio from 0.5% to 0.3%.
Almost half of pharma’s ad dollars – 46% — went to just five media companies, while the top five for OTC advertising gobbled up 41% of the dollars.
Paramount was the largest recipient from both pharma and OTC brands, with three other media giants also in each category’s top five: Google (#2 for pharma, Meta (#2 for pharma, ,#3 for OTC), Comcast (#3 for pharma, #4 for OTC) and Warner Bros. Discovery (#5 in both categories). Walt Disney, placed fourth in pharma spending, while Meta landed in second place for OTC spending.
(14)


