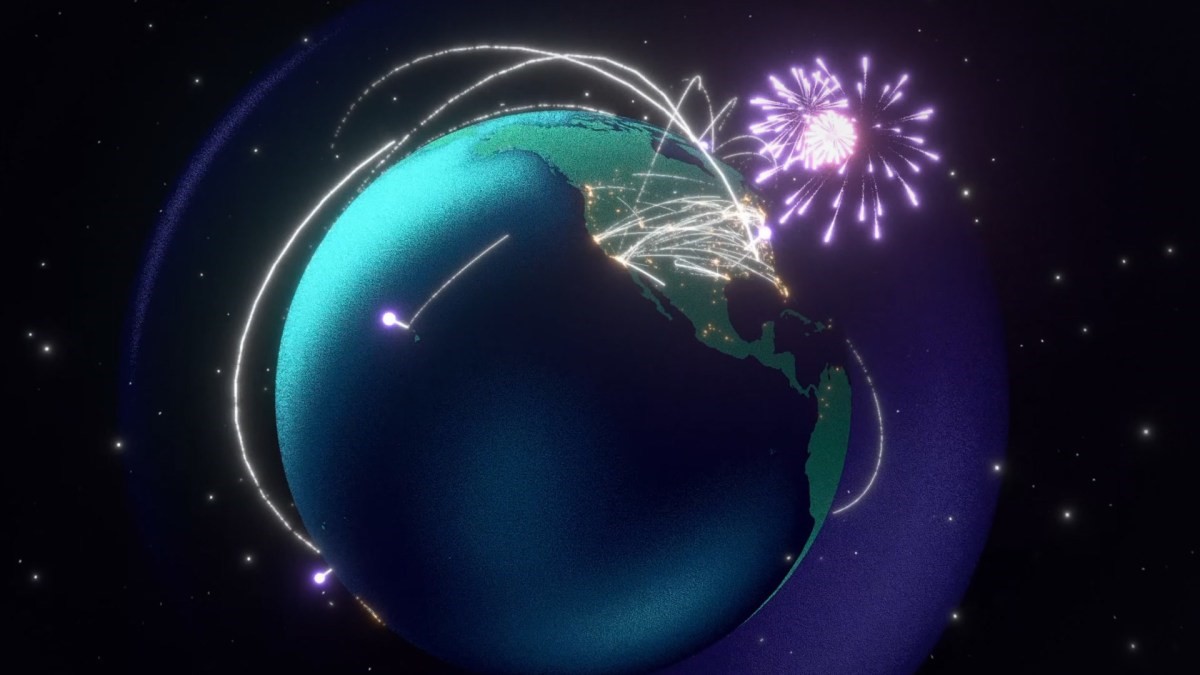
This globe shows just how much money people spend on Black Friday (it’s a lot)
This Black Friday, the e-commerce platform Shopify will show you exactly how shoppers are behaving in real time—and it’s using the latest AI technology to make it happen.
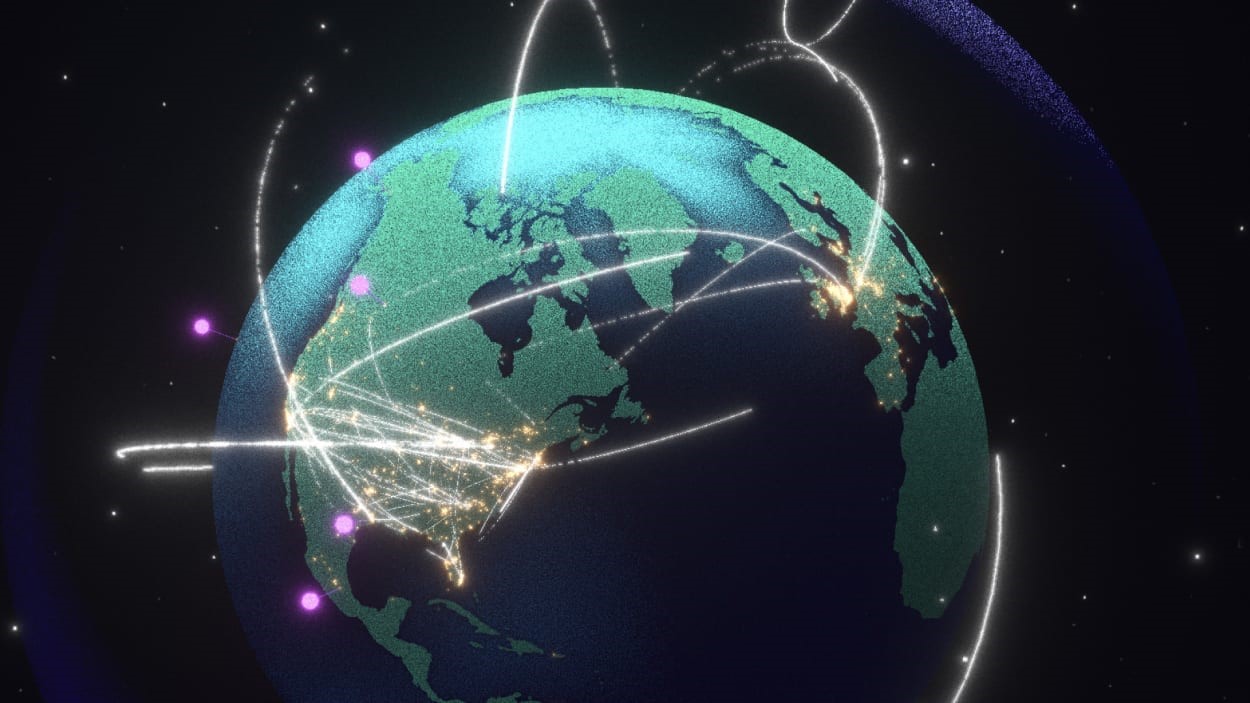
Shopify’s Black Friday Cyber Monday (BFCM) Live Globe is an annual data visualization project, and the 2023 iteration launches today. In the program’s zoomed-out view, a 3D Earth loads alongside an international dashboard. Each time a merchant makes a sale to a shopper, an arc of light shoots between their two locations to represent the transaction.
On the accompanying dashboard, users can see how many unique shoppers are visiting the site, orders per minute, most popular items, and even the carbon emissions that have been saved with every purchase (Shopify purchases carbon removal to eliminate the shipping emissions from orders placed during BFCM). To give a sense of Live Globe’s scale, Shopify merchants saw peak sales of more than $3.5 million per minute last year.
This year’s Live Globe is introducing several new features, including showing data for more than 1,700 cities worldwide. According to product innovation lead Russ Maschmeyer, it’s a league above previous iterations of the project.
“When we first started this effort, we started with very simple 3D visualizations on a globe, and they felt very flat, very dry, very much like early databases,” Maschmeyer says. “This year, what we really wanted to do is turn the juice up to 11.”
For the past three months, Maschmeyer and his five-person team of engineers and designers have been all-in on making the Live Globe as immersive as possible. To start, users can search specific cities and find key stats like local orders per minute, smallest order of the day, and the longest distance that an imported package will travel. These numbers are paired with quippy observations (for example, if more than 76 orders are placed in a minute, Live Globe might tell you that’s over the hotdog eating world record of 76 hot dogs). These fun facts are where ChatGPT comes in. In order to create thousands of unique sentences, Maschmeyer’s team trained ChatGPT to connect the dots between incoming data and interesting insights. The result is that every user will likely have a different experience interacting with the platform.
From a visual standpoint, Maschmeyer says improvements in technologies like WebGL and React Three Fiber have streamlined the rendering process for 3D objects on web browsers. The power of these tools allowed his team to fully rebuild their Earth model, now adding tiny details like stippling on the surface of the planet, glowing auras around city pins, and even real-time reflections from the light of each arc over the globe. The whole platform is designed to be reminiscent of 1960s space-age magazines, from the font choices to the risograph-esque art style.

Maschmeyer has worked in the data visualization space for many years, but 2023 stood out to him as a turning point. He believes that the technological tools that have emerged are opening up new possibilities for data design—and, no doubt, for future endeavors from Shopify’s team.
“Data visualization, at its heart, is really about storytelling,” Maschmeyer says. “I think the big lightbulb this year, especially with these new AI tools, is that language models that are aware of data and able to manipulate and work with it are going to unlock a tremendously new and powerful trajectory for storytelling with data. It will enable more people to think about and build experiences like [Live Globe].”
(17)


