This world map rates countries by the sustainability of their food systems
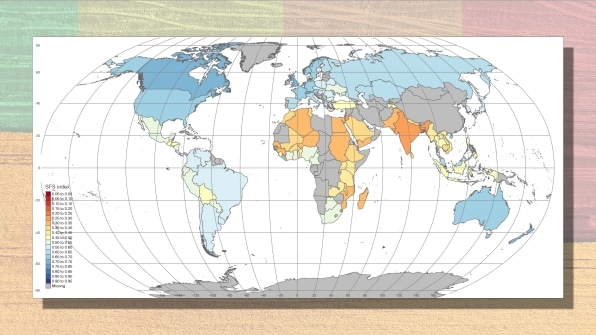
What we choose to eat can affect climate change, and that means all the factors involved in feeding our growing population—from agriculture to fair trade to food waste to the labor force—can have an impact on how sustainable our food system is. That’s a lot of information to track, but it’s important to have that big-picture perspective. And now we’re closer to it, thanks to a map created by the International Center for Tropical Agriculture (CIAT) that rates food sustainability for different countries around the world.
The map is less about ranking the “most” and “least” sustainable food systems, says Steven Prager, coauthor of the paper on the map published in Nature and a senior scientist at the research nonprofit CIAT. It’s more about allowing, finally, for a broad look at food systems around the world so we can compare what different countries are doing, and understand how all the facets of food sustainability are connected to inform the best policy decisions.

The term “food system” refers to the entire web of food production and consumption from beginning to end, from growing and harvesting to processing and packaging, from transportation and consumption to the disposal of food waste. And though this research is meant more to influence policy and track changes in food system sustainability over time, there are a few takeaways about the world’s food systems that just looking at the map can tell us. First, says Prager, the image has made it clear that there is a North versus South dynamic, showing that Northern countries currently have much more sustainable food systems than those in the South (on the map, the scale goes from blue to red, with blue showing high sustainability; gray means there is not enough data).
That relates to his second big point: that there clearly won’t be a “one size fits all” solution to creating sustainable food systems of the future because of how much variety there currently is. Even among countries that have been compared for their growing economies, like Brazil, Russia, and India, the levels of sustainability vary, and so a solution for one country to raise its sustainability metric may not be what another needs to maintain its level.
There’s not a lot of uniformity in food system research, and that’s part of what CIAT hopes to bring about with this map. “One of the things we realized is when ‘food systems’ started becoming a part of the regular jargon in the scientific community, the policy community, and the activist community, there wasn’t a lot of agreement on what exactly food systems were, how to evaluate them, and how to understand whether they are sustainable or not,” says Prager. “So what we did is designed a pretty structured and deliberate effort to characterize what is a sustainable food system, and then moved on to look at indicators for the sustainability of food systems.”
Researchers picked 20 indicators that fit into four themes: environment, economic, social, and food security and nutrition. That means everything from agricultural greenhouse gas emissions to the size of the female food labor force to diet quality and obesity rates were factored in. “If one were to look at food systems from a traditional angle, it’s oftentimes centered around productivity: Are we producing enough food? Are people getting enough calories?” Prager says. “But a big challenge with that is that it doesn’t actually address some of the more significant and potentially endemic issues,” such as are those calories resulting in obesity? Or, what’s happening with increasing urbanization?
“By looking across all different areas—we have both thematic areas and then across geographic areas—we’re able to start getting a sense of where food systems are working in the interest of the environment, in creating economic opportunities, in increasing people’s health, and . . . mitigating climate change, potentially,” he adds. That wide-ranging view is necessary to truly understand our food systems, and how they can be affected by different policy decisions.
This map will also be a living document, in the sense that the indicators assessed can be used to track changes in food system sustainability over time. All this information could not only help inform future policies on food sustainability, but those policies could potentially be tracked to see if they’re actually having a positive, or negative, impact. Then, since this map can compare food systems across different countries, we could take what we learn in one place and apply it to another. “If we don’t have a sense of how one country’s food system is similar or different than another country’s, then we don’t know about the portability of different approaches,” says Prager.
“What we have here is a map that allows a comparison, but also really more than anything, it’s a way of benchmarking what we can understand over time and between countries and regions,” he adds, “to get a sense of whether or not we are indeed moving in the right direction.”
(33)


