Understanding the Essence of Application Performance Monitoring (APM)
— June 5, 2019
Application Performance Monitoring is needed by every business that really cares about customers. As customers and app users, we all look forward to an operational, responsive, and fast user interface. Hence, APM involves the use of a monitoring solution technology that checks the performance of service providers’ apps or web-based channels with how their customers relate with their interfaces. Many businesses, today, rely on various software, either homegrown tools or commercial, to monitor the performance level of their apps.
APM, known as Application performance monitoring and often mentioned as Application Performance Management, refers to tools used by businesses to track the performance of their application on their users’ end; hence it measures the rate of customer engagement and tracks their journey or process during their use of the application platform. Having considered whatever issues an end user might get, it becomes easier for a business to locate what the problem is and to fix it immediately. The basic mystery is that it allows you to solve issues with your platform that you would not be able to identify and solve without an APM tool.
Why Use APM?

No one appreciates a platform that hangs or shutdown in the face of a dire need. Complaints will keep pouring in, showing that the customers are unsatisfied. In fact, a majority of users would not report the crash or hold-up; they would just move over to another source or service provider. It is why APM definition is needed for every customer-focused application.
Real User Monitoring
Understanding an app’s performance of the server end (backend) is great and important since it controls the general app functionality. However, it is vital to know how long it takes a browser to completely load a web or application content just like it would be on a user’s end. This is called Real User Monitoring. Real User Monitoring (RUM) is a feature that is anticipated from every APM so that customers can be delivered timely values and functions, as the main users.
How APM works
The most irritating things to the users of a web or application interface are
- Slow or unresponsive page
- Slow conversational response
Research has it proven that on e-commerce websites, slowdown occurs ten times more than users experience down servers; the cumulative slowdowns add up as impressions on customers’ mind with each and frequent slowdown. Another research shows that once there is a delay in communication between a customer and a business representative agent, for more than ten minutes, about 90 percent of the customers would rather not stay on the line. The ones that might stay would be ones that, probably, have no alternative means of getting a solution.
Therefore, it implies that it is good for a business to have applications and user interfaces up and running. That is not enough, however. There is the need to make sure that they continuously deliver real-time values to customers; there is the need to monitor the applications, to test IP protocols with network services. To provide relevant solutions that would help businesses to deliver good customer service and experience, IT departments of various organizations get automated software that would give immediate alerts once there is a technical or functionality breakdown or once a functionality is nearing the floor (usually, this is by setting a threshold mark for the alert to trigger, before there is a total breakdown). This Application Performance Management software, usually, helps to improve app speed and reliability.

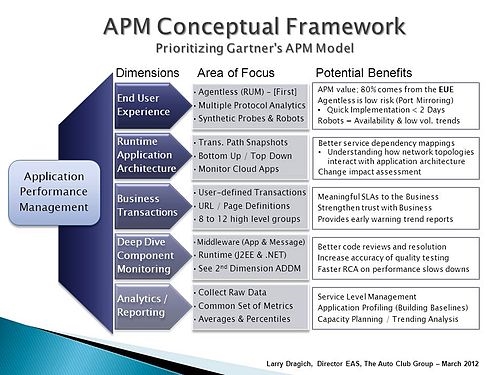
Gartner, the tech research firm, advised that a full-featured application performance management should include a good proportion or variation of the following features.
- End-User Experience Monitoring: the monitoring should identify and report a problem exactly as it affects the users and immediately.
- Application Discovery, Survey, and Diagnostics: The application’s runtime should be generated and surveyed to accurately predict the scope of the problem. Hence, the architecture, modeling, and display should be swift to run and provide a potential problem with clarity.
- Transaction Profiling: The user-defined transactions that led to the problem would be examined across various data paths shown by the runtime architecture graph. This is to confirm, by the graph, the touchpoints that might be the source of the problem an end-user encountered.
- Component Monitoring in Application Context: A deep monitoring of various nodes and touchpoints of the application are checked according to the context of the previous predictive context.
- IT and Analytics Control: After the whole steps, IT operators and analytics take over to investigate the root cause of the problem, based on the data gathered by the tool, in the previous steps. Furthermore, they confirm the problem fix and they prepare for similar end-user experience problems that might arise in the future.
Digital Experience monitoring is important to quantify, as well as optimize applications and various nodes to provide continuous delivery of quality user experience.
Types of Application Performance Monitoring Tools
- App metrics-based tools: Although they are also regarded as APM, what they do, at best, is to tell how many request and user engagements that an app has got. Also, they can diagnose potentially slow URLs. However, they do not tell the cause of a problem.
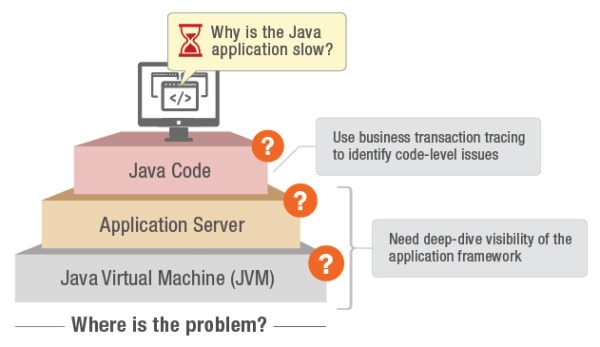
- Code-level based tools: This is the standard and the most common type of application performance management tool that digs through performance to the code-level of the app so that it can trace and profile whatever transactional issue is going on.
- Network-based tools: These are tools that measure application performances based on network dependent issues such as traffic. These tools are given a class of their own, tagged NPM.
A typical APM definition protocol is that it is able to collect log data. A programmer or developer requests for activity logs or crash logs if there were any issue reported about the failure of an application. That way, it is easier for developers to help businesses to access their logs, consider the problem and fix the problem to the root so that remedies can be provided for future and similar incidences. Therefore, application log data is a must-have feature for an APM.
Business & Finance Articles on Business 2 Community
(67)

