Unhappy Returns: Data Shows Marketers Should Focus On Messaging In Holiday Ads

Shoppers’ opinions on returning items bought online and in-store based on a PowerReviews survey in June of 7,688 U.S. consumers shows consumers in higher-income households are more likely interested in returns than lower-income households.
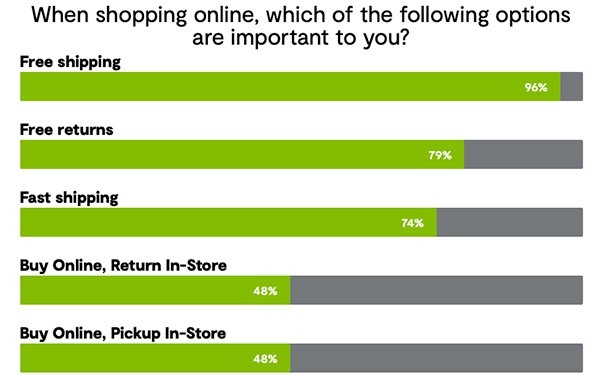
Data from the PowerReviews Consumer Survey: Returns in Retail in 2021 found 83% of consumers with incomes of more than $100,000 annually report that free returns are important vs. 75% of consumers with an annual income of $25,000.
About 76% of shoppers with an annual income of between $26,000 and $50,000 said free returns are important, while 77% of those with an annual income of between $51,000 and $75,000 said free returns are important. The number goes up to 80% for consumers who earn between $76,000 and $100,000.
Logically, it seems as if lower-income households would want an easy, free return policy, but as it turns out, high-income households have more discretionary income to spend on nice-to-have items, and they want the option to return the item if they change their mind. Lower-income households could be primarily doing online shopping for necessities that they don’t plan to return.
Returns from online purchases are as common as they were prior to the COVID-19 pandemic. Some 88% of consumers report they make returns at least “occasionally.” This aligns with industry reporting that says returns were up 70% year-over-year in 2020.
Some 22% said they make returns “sometimes,” while 5% said they do so “regularly,” 2% said “always” and 12% said they “never” do returns.
At 22%, those who earn less than $25,000 annually were also the most likely to say they would never return something. Some 5% of those who earn more than $100,000 annually were the least likely to return items.
When consumers were asked whether they return products purchased online more or less often than products you buy in-store, 47% said it is the same, while 33% said less, and 20% said more.
At 28%, GenZ were the most likely to say they returned items purchased online more frequently, and at 13% Boomers were the least likely to do so.
When comparing the frequency of returning items today vs. before the COVID-19 pandemic, 72% of consumers say they return online purchases at the same rate, while 15% said less and 13% said more.
Apparel, shoes, and electronics top the most-returned product categories. At 88%, clothing was the most common type of product that people returned. Shoes placed No. 2 at 44%, and electronics came in at No. 3 with 43%.
The data also suggests user-generated content (UGC) decreases the likelihood of returns.
When asked which forms of UCG would make a consumer less likely to return products bought online if viewed them prior to purchasing, 70% cited ratings and reviews, while 68% said questions and answers, and 67% said images and videos.
UGC is the most influential format for younger shoppers. Some 82% of Gen Z agreed that viewing UGC imagery prior to purchasing a product online would make them less likely to return it. Millennials were next at 73%, while Gen X came in at 61%, and Boomers at 51%.
Reviews also decrease the likelihood of returns at 75%, 75%, 64%, and 59%, respectively.
(37)