Why You Need to Know How to Benchmark Your Financial Ratios

Financial ratios measure the relative health of your business as it compares with other businesses in your industry. Not only is it important for a business to know how its performance relates to the competition, but it is also a tool that lenders will use if and when you ever apply for a loan.
Risk Management Associates (often just called RMA) each year publishes a document called the Annual Statement Study, which can be found in the reference section at many public libraries. The RMA Definitions of Ratios can be downloaded from the Free Downloads tab of this blog.
Whenever a business applies for a loan it completes a loan application. The various types of Assets and Liabilities of the applicant contained in their balance sheet, along with Revenue and Expenses from their Profit & Loss, are collected as part of the application process. Lenders share the applicant’s raw financial information data with RMA. The financial data received by RMA is then analyzed and codified, and the resulting information is placed in a large proprietary database.

RMA Layout
Here is a link to a sample Annual Statement Studies, industry bench marking report for soybean farming as an example.
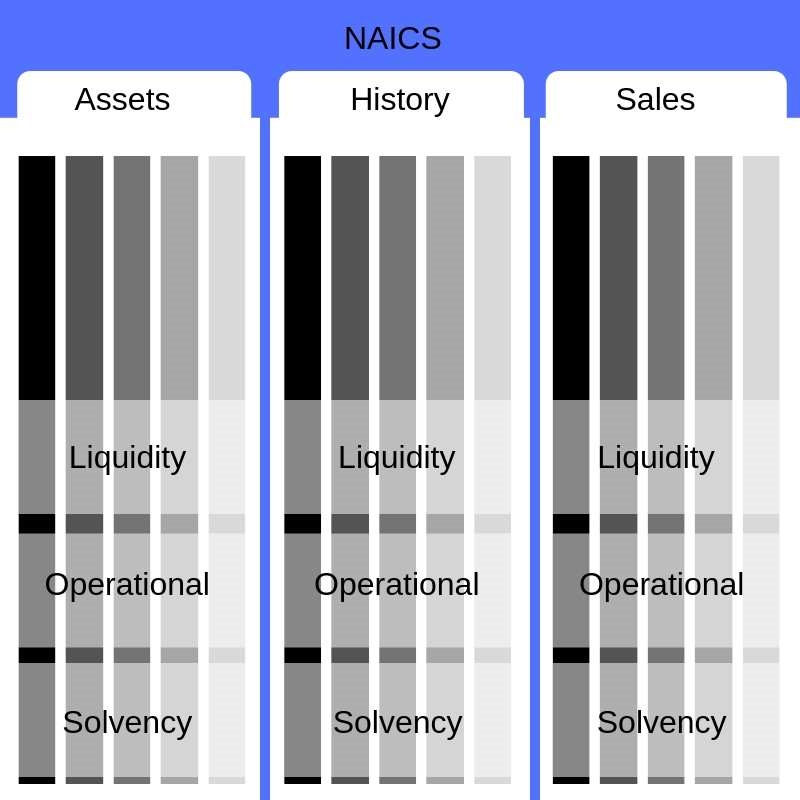
The information is then grouped by business type (NAICS/SIC). The industry-specific data is then sorted into three broad collections and listed by Total Asset, Historical, and Sales Volume. The values in each broad collection are further sequenced into several ranges to give greater fidelity to the data. Finally, the data are combined in various ways to create financial ratios.
METRICS TO GUIDE SMALL BUSINESS OWNERS
Financial ratios are used by lending institutions to compare your business to others in your industry. For each range contained in each of the three broad collections is a series of financial ratios that are divided into three broad categories.
- Liquidity Ratios – like Current Ratio and Quick Ratio, which measure the ability of the businesses to cover expenses.
- Operational Ratios – like Inventory Turns and A/R Turn Over, which are measures of operating efficiency.
- Solvency Ratios – like Debt to Worth or Net Sales to Working Capital, which measure the business’s ability to repay debt.
Small business owners should analyze the following Statement Studies metrics to measure performance and, in turn, make decisions that improve business efficiency:
- Operating Metrics
- Gross Profit Margin
- A lower-than-average gross profit margin may be an indication that you are charging too little for products or paying too much for inventory or materials. When you’re first starting out, comparing your gross profit margin to Statement Studies can help you figure out what kind of mark-up is most appropriate.
- Operating Margin
- A higher number indicates a company is performing well. If your gross profit margin is strong, but your operating margin is below average, consider reducing or rearranging expenses to improve your profitability. The operating margin metrics in Statement Studies can also be invaluable in budgeting for your year, and banks look at profitability metrics to determine if your company generates enough profit to service debt obligations.
- Change in Net Sales
- If your company’s change in net sales is significantly lower than peers, you may need to make changes to product mix, pricing, or seek out other strategies for increasing sales year-over-year.
- Liquidity Metrics
- Days Receivables (Sales/Receivables Ratio divided by 365)
- Generally, the greater number of days outstanding, the greater the probability of delinquencies in accounts receivable. If your company’s days’ receivable are significantly higher than average, you may want to look at your collection process and work to collect receivables on a more timely basis.
- Days Payables (Cost of Sales/Payables divided by 365)
- The higher the turnover of payables, the shorter the time between purchase and payment. If your turnover is lower than the industry average, you may have leverage to seek out extended terms.
- Days Receivables (Sales/Receivables Ratio divided by 365)
- Leverage Metrics
- Debt/Equity (Total Liabilities divided by Shareholders’ Equity)
- A low debt-to-equity ratio in Statement Studies may indicate that peer companies are typically funded with more shareholder funds than debt. Banks will also commonly look at this metric to determine creditworthiness. Red flags are raised when a company’s debt/equity ratio is too high.
- Debt/Equity (Total Liabilities divided by Shareholders’ Equity)
METRICS THAT LENDERS USE TO EVALUATE SMALL BUSINESSES
Lenders such as bankers frequently analyze the following Statement Studies metrics to evaluate a business’s creditworthiness, so small business owners should certainly be aware of common benchmarks for these metrics even if they don’t necessarily drive business decisions:
- Operating Metrics
- % Profits Before Taxes/Tangible Net Worth and % Profits Before Taxes/Total Assets
- Both are indicators of management performance and express how efficient and well-capitalized a company is.
- Net Cash after Operations
- This ratio reflects the amount of cash available for servicing interest on bank debt. In other words, it adjusts the cash after operations to reflect net cash outflows or inflows arising from changes in income taxes and miscellaneous assets and liabilities.
- Sustainable Growth Rate (SGR)
- Sustainable Growth Rate is a single number representing the annual percentage increase in sales that is consistent with a stable debt and capital structure (i.e., where total debt/net worth ratios do not change significantly or materially, from year to year). If a company’s sales expand at a rate greater than the SGR, the company’s debt/worth ratio will rise and result in an “out-of-equilibrium situation.” When this happens, the firm approaches an over-leveraged position that raises the possibility of liquidity and debt repayment problems.
- % Profits Before Taxes/Tangible Net Worth and % Profits Before Taxes/Total Assets
- Liquidity Metrics
- Current Ratio
- Generally, the higher the current ratio, the greater the “cushion” between current obligations and a firm’s ability to pay them. While a stronger ratio shows that the numbers for current assets exceed those for current liabilities, the composition and quality of current assets are critical factors in the analysis of an individual firm’s liquidity.
- Quick Ratio
- Also known as the “acid test” ratio, this liquidity measure is stricter and more conservative than the current ratio. This ratio reflects the degree to which a company’s current liabilities are covered by its most liquid current assets, the kind of assets that can be converted quickly to cash and at amounts close to book value. Inventory and other less liquid current assets are removed from the calculation. Generally, if the ratio produces a value that’s less than 1 to 1, it implies a “dependency” on inventory or other “less” current assets to liquidate short-term debt.
- Days Payables
- If a company’s accounts payables appear to be turning more slowly than the industry, then a bank may assume the company is experiencing cash shortages, disputing invoices with suppliers, enjoying extended terms, or deliberately expanding its trade credit.
- Current Ratio
- Coverage Metrics
- Net Cash after Operations
- This ratio helps a banker determine whether a business can meet all its operating needs and has sufficient funds remaining to meet principal and interest debt-service requirements and to cover dividends. If the ratio is less than 1:1, it indicates a company must borrow funds to meet some or all of its financing obligations.
- Earnings Before Interest and Taxes (EBIT)/Interest
- This ratio measures a firm’s ability to meet interest payments. A high ratio may indicate that a borrower can easily meet the interest obligations of a loan. This ratio also signals to a bank a firm’s capacity to take on additional debt.
- Net Profit + Depreciation, Depletion, Amortization/Current Maturities Long-Term Debt
- This ratio reflects how well cash flow from operations covers current maturities. Because cash flow is the primary source of debt retirement, the ratio measures a firm’s ability to service principal repayment and take on additional debt. Even though it is a mistake to believe all cash flow is available for debt service, this ratio is still a valid measure of the ability to service long-term debt.
- Net Cash after Operations
- Leverage Ratios
- Funded Debt/EBITDA
- As the calculated ratio grows larger, a borrower is likely to have more difficulty in meeting its debt obligations.
- Fixed/Worth
- A lower Fixed/Worth ratio indicates a proportionately smaller investment in fixed assets in relation to net worth and a better “cushion” for creditors in case of liquidation. Similarly, a higher ratio indicates the opposite situation. The presence of a substantial number of fixed assets that are leased – and not appearing on the balance sheet – may result in a deceptively lower ratio.
- Debt/Worth
- This ratio essentially demonstrates how much protection is provided to creditors by the owners. The higher the ratio, the greater the risk a firm will be assumed by creditors. A lower ratio generally indicates greater long-term financial safety. Unlike a highly leveraged firm, a firm with a low debt/worth ratio usually has greater flexibility to borrow in the future.
- Funded Debt/EBITDA

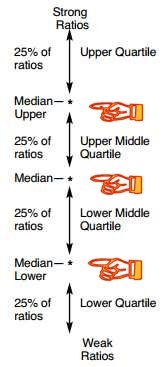
To help you understand where your business stands compared to your peers, the median (middle) value is identified, and then they identify the median value of each half, thereby creating three values that define what they call quartiles.
If your computed ratio is greater then the highest of the three values printed, you would be considered to be in the upper quartile, or top 25%, of businesses in your industry. If your computed value was between the highest and middle value, you would be in the upper middle quartile, or between 75% and 50% of all business in your industry, and so on.
When was the last time you benchmarked your financial ratios against other businesses in your industry?
Business & Finance Articles on Business 2 Community
(54)

